Core Data is Apple’s object graph management and persistency framework for iOS, macOS, watchOS, and tvOS. It’s around for a long time and therefore a great solution to use for persistent storage of structured data in your application. Core Data Debugging might be a bit hard, although some less-known functionalities in Xcode can help you a lot.
“A great way to get you up to speed is by watching the WWDC sessions on Core Data.”
Transform Your Career with the iOS Lead Essentials — Limited Offer Unlock over 40 hours of expert training, mentorship, and community support to secure your place among the best devs. Click now for early access to this limited offer and a FREE crash course!
Exploring the SQL database
To get a better sense of what your app is exactly saving it’s useful to open the SQL database directly. The easiest way to retrieve the database location is by enabling the SQL Debug Output:
-com.apple.CoreData.SQLDebug 1You can set this argument in Xcode’s scheme editor to enable SQL Core Data Debugging:
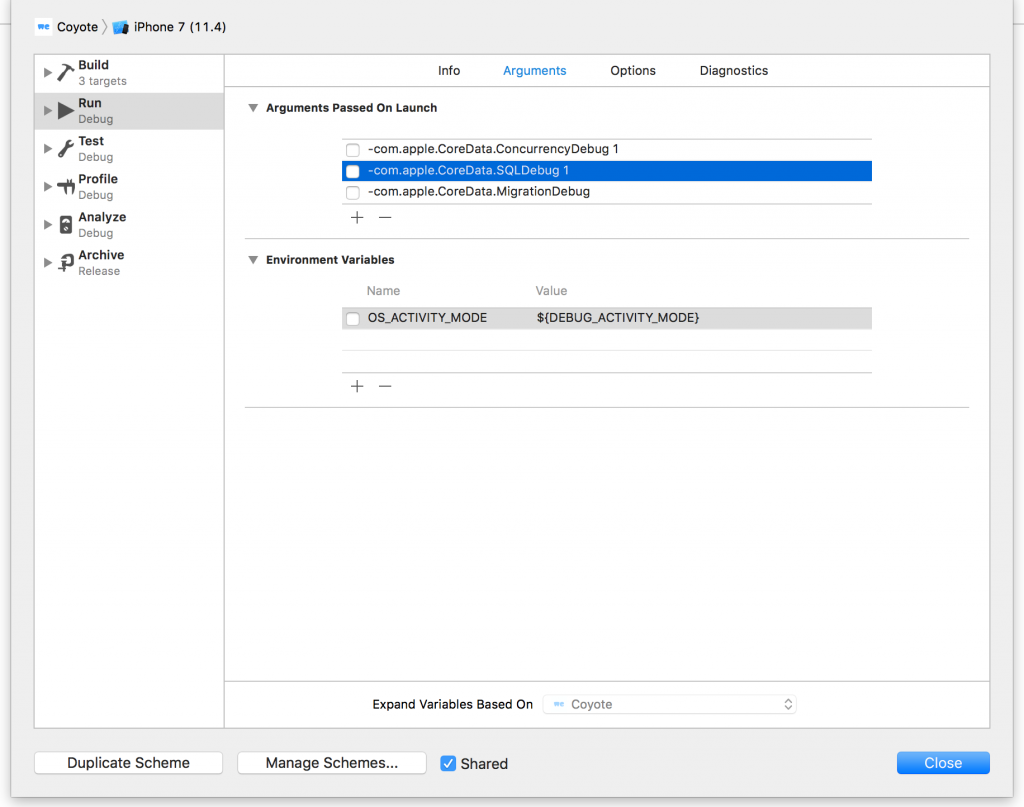
The level can be set up to 4 to enable a more verbose level of output. It will give you insight into the executed fetch requests, accessed properties or saved data and is a great tool for Core Data Debugging in general.
When you launch your app it will also show you the location of the sqlite database file:
CoreData: annotation: Connecting to sqlite database file at "/Users/antoinevanderlee/Library/Developer/CoreSimulator/Devices/AB66C5B9-D1C1-45C4-9324-DB0E91FAB4F9/data/Containers/Shared/AppGroup/C6934424-5E58-4164-8593-3CC0D60D2BB5/Coyote.sqlite"
Query performances
The same SQL debugging launch argument can be used to discover heavy queries or places in your app which trigger a lot of requests. WWDC 2018’s Core Data Best Practices session walks through this technique in more detail.
Thread safety
Core Data is designed to work in a multithreaded environment. However, not every object under the Core Data framework is thread-safe. To use Core Data in a multithreaded environment, ensure that:
- Managed object contexts are bound to the thread (queue) that they are associated with upon initialization
- Managed objects retrieved from a context are bound to the same queue that the context is bound to
To make sure you’ve done a good job you can enable the launch argument for concurrency debugging:
-com.apple.CoreData.ConcurrencyDebug 1This will show the following line in your debugging console:
CoreData: annotation: Core Data multi-threading assertions enabled.After you’ve enabled concurrency debugging you can go through some flows in your app and an exception will be thrown when a concurrency issue occurs.
Migration debugging
Core Data migrations mostly are done by lightweight migrations. Whenever you need to do a heavyweight migration you’re often on your own as there are nearly a few resources on how to do this. Objc.io has a great book to get you started.
-com.apple.CoreData.MigrationDebug 1Using the migration debug launch argument will give you insights in the console about exceptional cases as it migrates data.
WWDC Sessions
A great way to get you up to speed is by watching the WWDC sessions on Core Data. Almost every year they cover a lot of valuable updates on best practices with the latest API in the “What’s New in Core Data” sessions.