The MetricKit framework allows us to collect all kinds of data from our end users, including launch times and hang rates. MetricKit data can be explored by going into the Xcode organizer panel in which several metrics are listed.
Several techniques exist to improve launch times, but it all starts with gaining insights into how good or bad your application performs. Personally, I don’t often open the Xcode organizer to look into this data and I also don’t want to raise a notification myself once the performance decreased. A much better solution would be to have the same data next to your existing tracking tools, for which I decided to dive into the MetricKit APIs.

Using MetricKit to monitor performance
At WeTransfer we’re building several apps with a relatively small group of 5 developers. Keeping an eye on the performance of multiple apps that all reach millions of users can be time-consuming. For that reason, we decided to set up monitoring based on metrics that will notify us of outperforming metrics.
We collect two of those metrics using MetricKit which we show as green or red inside our Datadog dashboard:
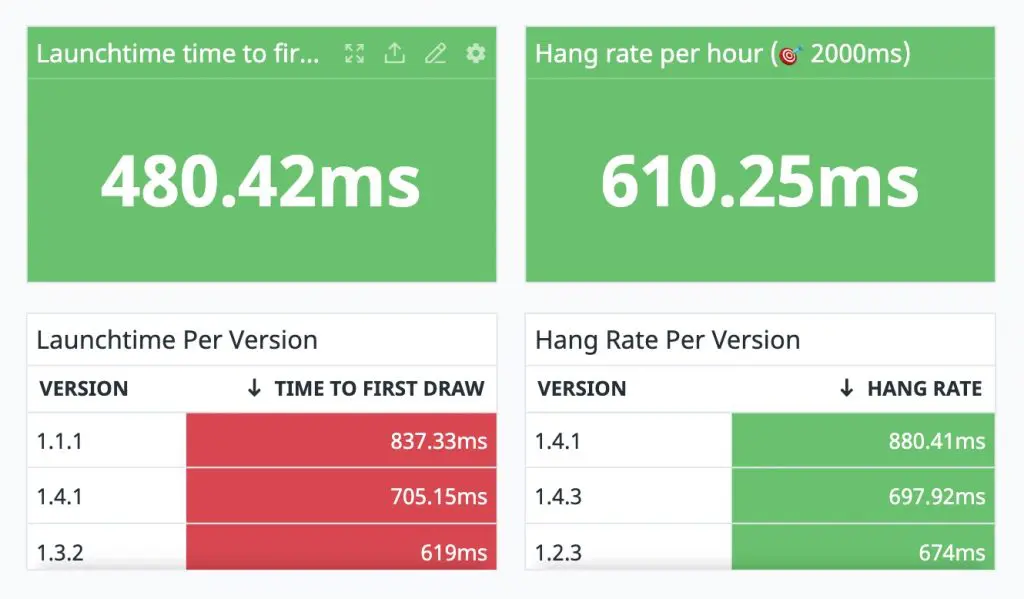
Both metrics allow us to gain insights into the same metrics as known from the Xcode organizer. Until now, we couldn’t find a more reliable way to gain insights into the average time to first draw and the hang rate per hour. We had ways of gaining insights using environment variables, but we were unable to turn these into trackable data. On top of that: we aimed to get the same values as Xcode Organizer would show. Otherwise, we would still want to look into the organizer data every now and then.
Understanding how MetricKit collects data
It’s important to understand how MetricKit works before diving into any code, to prevent yourself from running into surprises.
MetricKit allows you to receive on-device app diagnostics as known from the Xcode Organizer metrics. Metric reports are delivered at most once per day and contain data from the previous 24 hours. Diagnostics reports deliver immediately starting from iOS 15 and macOS 12.
A Metric report could contain data from several app versions since the user could’ve installed an update in the past 24 hours. This is important to take into account when collecting an average performance for a specific app version.
Metrics report in the form of histograms that record the frequency of observed values over a day. If a user opens your app multiple times in 24 hours, there’s likely a higher frequency to report. You can use these histograms to calculate an average value for a certain metric for that specific user.
Lastly, MetricKit allows collecting more metrics compared to the Xcode Organizer. Examples of extras include pixel luminance, cellular network conditions, and durations for custom OSSignpost events from your app.
Subscribing to report deliveries
To start collecting MetricKit data you have to subscribe to receive any reports for a specific user. You can do this by adding yourself as a delegate of the MXMetricManager:
MXMetricManager.shared.add(self)In this article, we’re going to focus on collecting the average time to first draw and the hang rate per hour for a specific app version. To be able to collect this data we only have to implement the following delegate method:
extension TrackingService: MXMetricManagerSubscriber {
    public func didReceive(_ payloads: [MXMetricPayload]) {
        // Implementation details will follow
    }
}
There’s another delegate method allowing you to collect Diagnostics payloads which we won’t cover in this article.
Calculating MetricKit average values
To calculate average values for a specific Metric we have to start by looking into the MXMetricPayload class. Each MetricKit report can contain multiple payloads of which all can contain a different set of data depending on the user’s usage of the last 24 hours.
Payload properties like latestApplicationVersion and includesMultipleApplicationVersions tell us more about the specifics of a payload and allow us to filter out data from older app versions. In our case, we simply ignore payloads containing data from old app versions. Doing so results in fewer data to use, but simplifies our logic by a lot.
The implementation starts by defining a new protocol called HistogrammedTimeMetric:
protocol HistogrammedTimeMetric {
    var histogram: MXHistogram<UnitDuration> { get }
    var average: Measurement<UnitDuration> { get }
}
We implement the average property for this protocol as a default implementation:
extension HistogrammedTimeMetric {
    /// Calculates the average duration in milliseconds for the given histogram values.
    var average: Measurement<UnitDuration> {
        let buckets = histogram.bucketEnumerator.compactMap { $0 as? MXHistogramBucket }
        let totalBucketsCount = buckets.reduce(0) { totalCount, bucket in
            var totalCount = totalCount
            totalCount += bucket.bucketCount
            return totalCount
        }
        let totalDurations: Double = buckets.reduce(0) { totalDuration, bucket in
            var totalDuration = totalDuration
            totalDuration += Double(bucket.bucketCount) * bucket.bucketEnd.value
            return totalDuration
        }
        let average = totalDurations / Double(totalBucketsCount)
        return Measurement(value: average, unit: UnitDuration.milliseconds)
    }
}
Since the frequency of a histogram differs, we have to calculate the average by dividing the total duration by the total buckets count. The resulting outcome is returned as a measurement of milliseconds.
Both MXAppLaunchMetric and MXAppResponsivenessMetric can conform to this protocol as follows:
extension MXAppLaunchMetric: HistogrammedTimeMetric {
    var histogram: MXHistogram<UnitDuration> {
        histogrammedTimeToFirstDraw
    }
}

extension MXAppResponsivenessMetric: HistogrammedTimeMetric {
    var histogram: MXHistogram<UnitDuration> {
        histogrammedApplicationHangTime
    }
}
Our HistogrammedTimeMetric protocol allows reusing code with different kinds of Metrics. You could potentially add other (future) metrics using this technique as well.
Now that we can calculate the average for a specific Metric value, we want to be able to filter it down to a specific app version. We can reuse our earlier created protocol to create a convenience method on a collection of payloads:
extension Array where Element == MXMetricPayload {

    /// Calculates the average Metric value for all payloads containing the given key path for the given application version.
    func average<Value: HistogrammedTimeMetric>(for keyPath: KeyPath<MXMetricPayload, Value?>, applicationVersion: String) -> Measurement<UnitDuration>? {
        let averages = filter(for: applicationVersion)
            .compactMap { payload in
                payload[keyPath: keyPath]?.average.value
            }

        guard !averages.isEmpty else { return nil }

        let average: Double = averages.reduce(0.0, +) / Double(averages.count)
        guard !average.isNaN else { return nil }

        return Measurement(value: average, unit: UnitDuration.milliseconds)
    }

    private func filter(for applicationVersion: String) -> [MXMetricPayload] {
        filter { payload in
            guard !payload.includesMultipleApplicationVersions else {
                // We only want to use payloads for the latest app version
                return false
            }
            return payload.latestApplicationVersion == applicationVersion
        }
    }
}
Since we have multiple payloads, we also have multiple averages. We need to combine all payload averages to calculate the average value over all payloads. We use the given key path and application version to filter out any unrelated Metric values.
Using the MetricKit averages
Now that we’re able to calculate the averages we can start tracking them into a tracking service of your choice. Tracking services often allow you to track an event with properties. Such implementation could look as follows:
extension DatadogService: MXMetricManagerSubscriber {
    public func didReceive(_ payloads: [MXMetricPayload]) {
        guard let currentAppVersion = Bundle.main.infoDictionary?["CFBundleShortVersionString"] as? String else {
            return
        }

        var attributes: [String: Double] = [:]

        if let averageTimeToFirstDraw = payloads.average(for: \.applicationLaunchMetrics, applicationVersion: currentAppVersion) {
            attributes["first_draw_avg"] = averageTimeToFirstDraw.value
        }
        if let averageHangTime = payloads.average(for: \.applicationResponsivenessMetrics, applicationVersion: currentAppVersion) {
            attributes["hang_time_avg"] = averageHangTime.value
        }

        guard !attributes.isEmpty else { return }

        // This example makes use of Datadog:
        DDGlobal.rum.addUserAction(
            type: .custom,
            name: "metrics_received".convertForTracking(),
            attributes: attributes
        )
    }
}
A tracking event is sent once there’s at least one average to report. The attributes can be used in the tracking service of your choice to show the values inside a dashboard.
Conclusion
MetricKit allows us to collect all kinds of Metrics that we would normally only read from Xcode’s Organizer. We gain quality insights by filtering down averages from payloads related to a specific app version. A protocol-oriented approach allows adding other Metrics with relatively small effort.
If you like to improve your Swift knowledge, even more, check out the Swift category page. Feel free to contact me or tweet me on Twitter if you have any additional tips or feedback.
Thanks!