When you receive an unreadable crash report, you can symbolicate crash logs with the help of Xcode. As a developer, it’s essential to identify symbols and ensure you can fix a crash that potentially affects many of your app’s users.
Many of us will benefit from an online platform like Firebase or Datadog, which will symbolicate crash logs for us. However, there are cases in which you receive ips files extracted from the Console app after one of your colleagues encountered a crash. Before you can read those logs, you need to symbolicate the symbols. This article starts by explaining two essential file formats in this process: IPS and DSYM files.

What are ips files?
IPS files are crash reports generated by apps that store data as JSON in files with an .ips extension. This file format was first introduced in iOS 15 and macOS 12. The JSON contains two main objects:
- IPS Metadata describing the crash on a higher level
- Crash Report Data describing the crash in detail with threading information
If you want to know more about this file format, I encourage you to read Interpreting the JSON format of a crash report.
What are dSYM files?
A dSYM file is a Debug Symbole File (hence the name) generated by Xcode and contains all the necessary debugging information to symbolicate your crash log. In other words, you need to use a dSYM file that matches the app version of the crash report to turn a crash report into a readable format.
Exporting Crash Reports from Xcode
Before diving into symbolicating crash logs, I’d like to explain how you can benefit from a technique that helped me solve many crashes. Occasionally, a colleague calls me out, telling me our app crashed on their device. Ideally, you could find back crash reports on an online platform like Datadog. However, there are cases in which you need to ask the colleague to extract the crash report manually.
Exporting Crash Reports using Xcode
Those colleagues that got Xcode installed can follow the following steps to export Crash Reports:
- Open Xcode
- Go to the menu bar and select Window → Devices and Simulators
- Click on Open Recent Logs
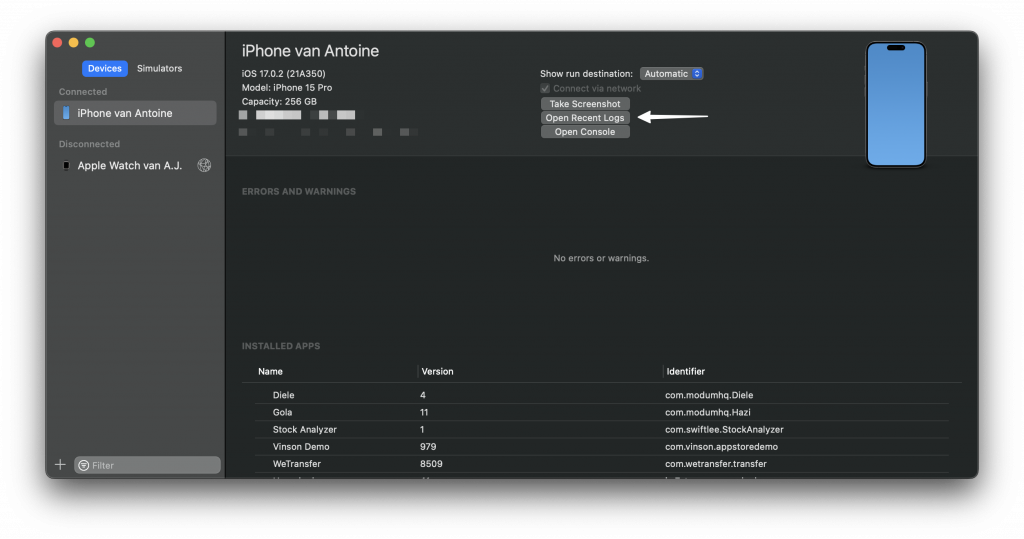
A Finder window will open after clicking “Open Recent Logs”, showing all ips files for crash logs related to the device. Your colleague should right-click the most recent crash file for your app and select “Show in Finder” to be able to share the file with you directly.
Finding Device Crash Logs without Xcode
In case your colleague doesn’t have Xcode installed, you can ask them to follow these steps:
- Connect the device to your Mac
- Open Finder and choose Go → Go to Folder from the menu bar
- Enter
~/Library/Logs/CrashReporter/ - Open the folder identified by your device’s name
- Select the logs named after your app
Note that this method doesn’t always work as expected, so I always try to use Xcode if possible.
Exporting Mac app Crash Reports
For Mac apps, exporting crash reports can be done using the Console app:
- Open the Console app
- Select Crash Reports in the sidebar
- Export the crashes named after your app
This is how that window looks for me:
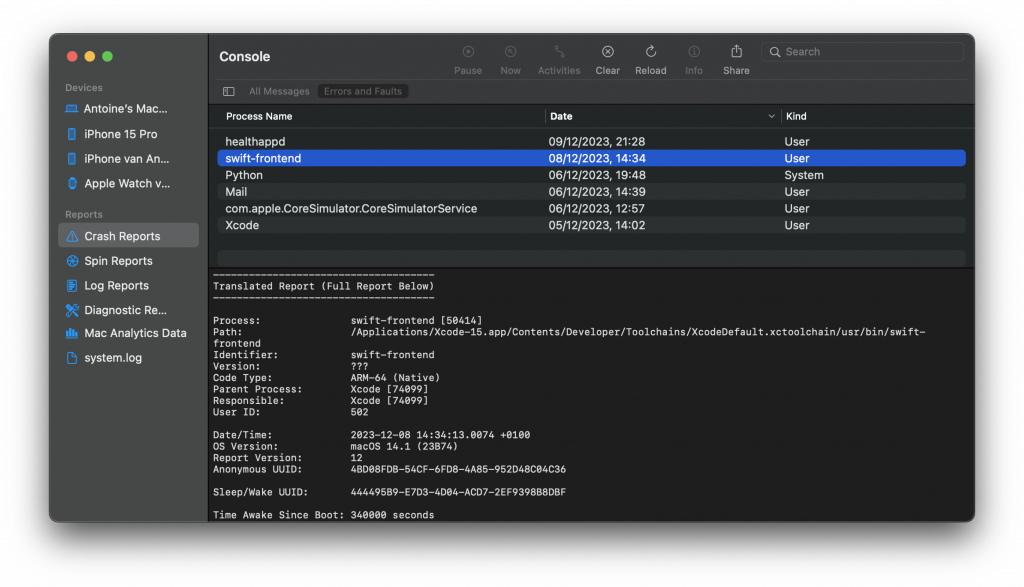
Your colleague needs to find a crash report in which the Process Name matches the name of your application.
How to manually symbolicate a crash log
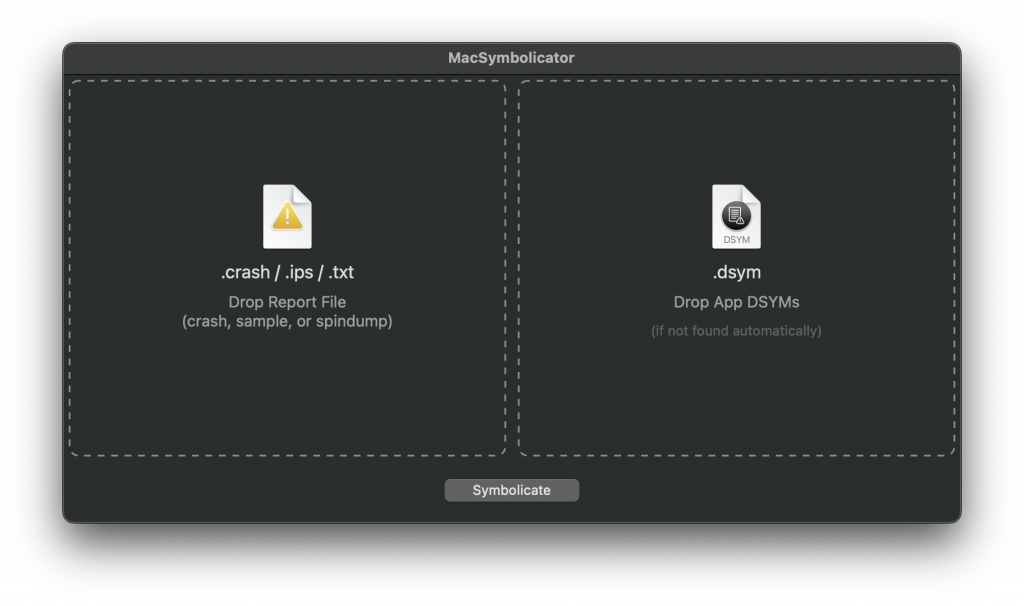
Back in the day, I’d start explaining how to manually symbolicate a crash log using the terminal. However, luckily enough, we’re now able to benefit from a fantastic open-source application called MacSymbolicator.
The application allows you to select a crash report on the left-hand side and dSYM files on the right. It supports old .crash file extensions and the new .ips and .txt formats. The best thing is that it will automatically scan your Mac for a matching dSYM file for the crash report.
For example, I’ve been able to change a RocketSim crash log from:
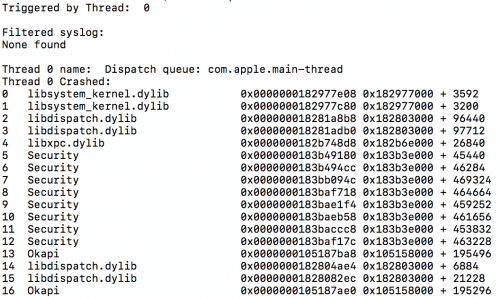
Crashed Thread:        0  Dispatch queue: com.apple.main-thread

Exception Type:        EXC_BREAKPOINT (SIGTRAP)
Exception Codes:       0x0000000000000001, 0x00000001026574e4

Termination Reason:    Namespace SIGNAL, Code 5 Trace/BPT trap: 5
Terminating Process:   exc handler [7689]

Thread 0 Crashed::  Dispatch queue: com.apple.main-thread
0   RocketSim                     	       0x1026574e4 0x102500000 + 1406180
1   RocketSim                     	       0x10265727c 0x102500000 + 1405564
2   SwiftUI                       	       0x1bbcebd50 0x1bac1b000 + 17632592
3   RocketSim                     	       0x10265671c 0x102500000 + 1402652
4   RocketSim                     	       0x102655a28 0x102500000 + 1399336
Into a more readable format:
Crashed Thread:        0  Dispatch queue: com.apple.main-thread

Exception Type:        EXC_BREAKPOINT (SIGTRAP)
Exception Codes:       0x0000000000000001, 0x00000001026574e4

Termination Reason:    Namespace SIGNAL, Code 5 Trace/BPT trap: 5
Terminating Process:   exc handler [7689]

Thread 0 Crashed::  Dispatch queue: com.apple.main-thread
0   RocketSim                     	       0x1026574e4 closure #1 in GridView.thinGridLines(geometry:) (in RocketSim) (GridView.swift:50) + 1406180
1   RocketSim                     	       0x10265727c closure #1 in GridView.thinGridLines(geometry:) (in RocketSim) (GridView.swift:50) + 1405564
2   SwiftUI                       	       0x1bbcebd50 0x1bac1b000 + 17632592
3   RocketSim                     	       0x10265671c GridView.thinGridLines(geometry:) (in RocketSim) (GridView.swift:65) + 1402652
4   RocketSim                     	       0x102655a28 closure #1 in GridView.body.getter (in RocketSim) (GridView.swift:27) + 1399336
The symbolicated crash report tells me I must look into the GridView.thinGridLines(geometry:) method to solve the crash.
Solving a symbolicated crash report
Now that we’ve symbolicated our crash report, it’s crucial to take a step back and consider whether you want to spend time solving the crash. Like with all tasks, you need to prioritize and determine how many users are likely affected by the same crash. Ideally, you’d solve all crashes, but in my experience, that’s never possible.
Therefore, I always open Xcode Organizer to determine whether more users are having a similar crash. This works great since Xcode will collect and symbolicate crash reports for users that opted in for sending logs:
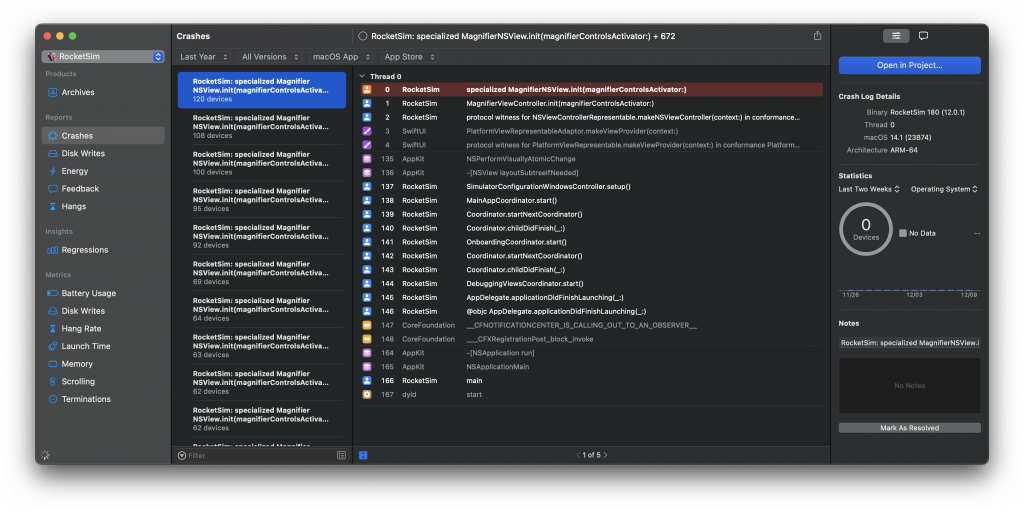
In my example, I decided to instead focus on another crash that affects many more users.
An extra benefit of finding your crash inside Xcode is that you can navigate directly to the code related to the crash. This can drastically impact the time you spend finding out where and how a crash occurred.
Lastly, I recommend always looking at the code where the crash occurred. If you can fairly quickly indicate the cause of a crash, you could solve it as a quick win.
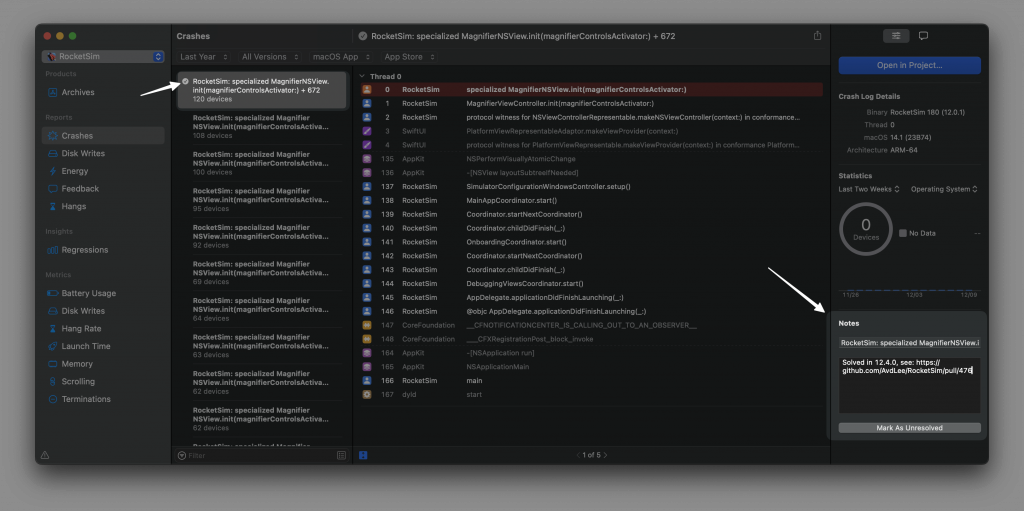
Mark the crash as resolved and add a note for your future self to ensure regressions are easier to follow up:
Conclusion
Knowing how to manually symbolicate a crash report is a crucial skill for an app developer. It allows you to increase the stability of your app and improve the user experience. Xcode provides several tools to help you solve and manage incoming crash reports.
If you like to improve your Xcode knowledge, even more, check out the Xcode category page. Feel free to contact me or tweet me on Twitter if you have any additional tips or feedback.
Thanks!