A user diagnostics report that helps you solve bugs and improve user support at the same time. I’ve been writing apps since 2009, and the Diagnostics repository is an outcome of all that experience. Used by major apps from companies like WeTransfer, it has proven its value time after time.
I’ve seen consistent inefficiency at many companies: a user reports a bug, and the first thing you need to ask is which version they’re running on. This is just one of the example questions one might ask. I’ve leveled up the quality of support for my developer tool, RocketSim, by introducing Diagnostics Reports. With Diagnostics supporting agentic development, it’s becoming even easier to analyze user issues.

The common issue with App Support channels
You’ve built your app, set up a support channel, and you’re receiving more and more feedback. This is all great, since feedback means an opportunity for improvement. However, many of the requests you get also involve exceptional bugs that are hard to reproduce: you need more information.
Instead of solving the bug right away, you first need to go back and forth with the user to get more details. It’s likely you’re asking questions like:
- What OS version are you using?
- Did you update to the latest version of the app?
While there are many solutions that give you these answers straightaway, I didn’t find any solution that would combine this with smart insights, system- and debug logs, combined with all kinds of session details.
Introducing an Open Source library: Diagnostics
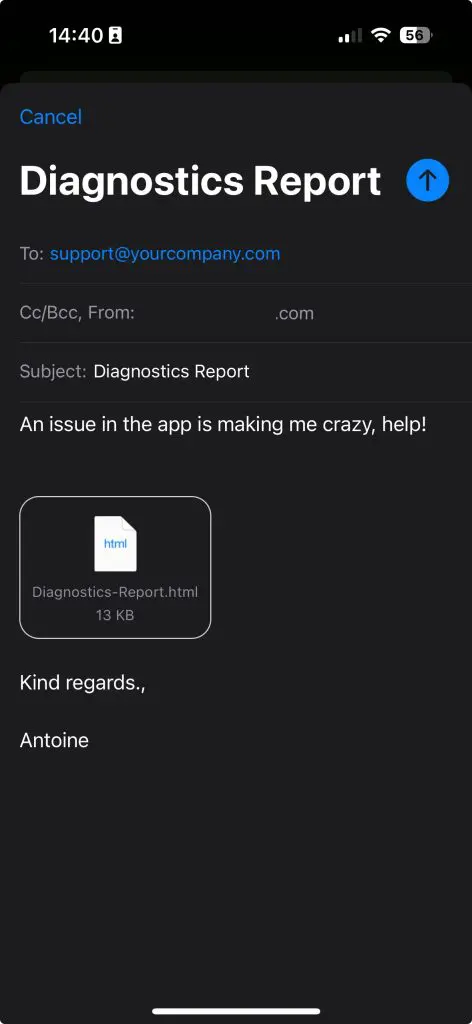
I’m happy to introduce you to my open source library, Diagnostics. It’s built on my experience building apps and supporting bug fixes since 2009. The library offers an in-app way to report issues and attaches a so-called Diagnostics Report: a detailed HTML file.
Whenever a user shares feedback within the app, they can write an email and share their story. The detailed HTML report will be attached and will provide the necessary technical information.
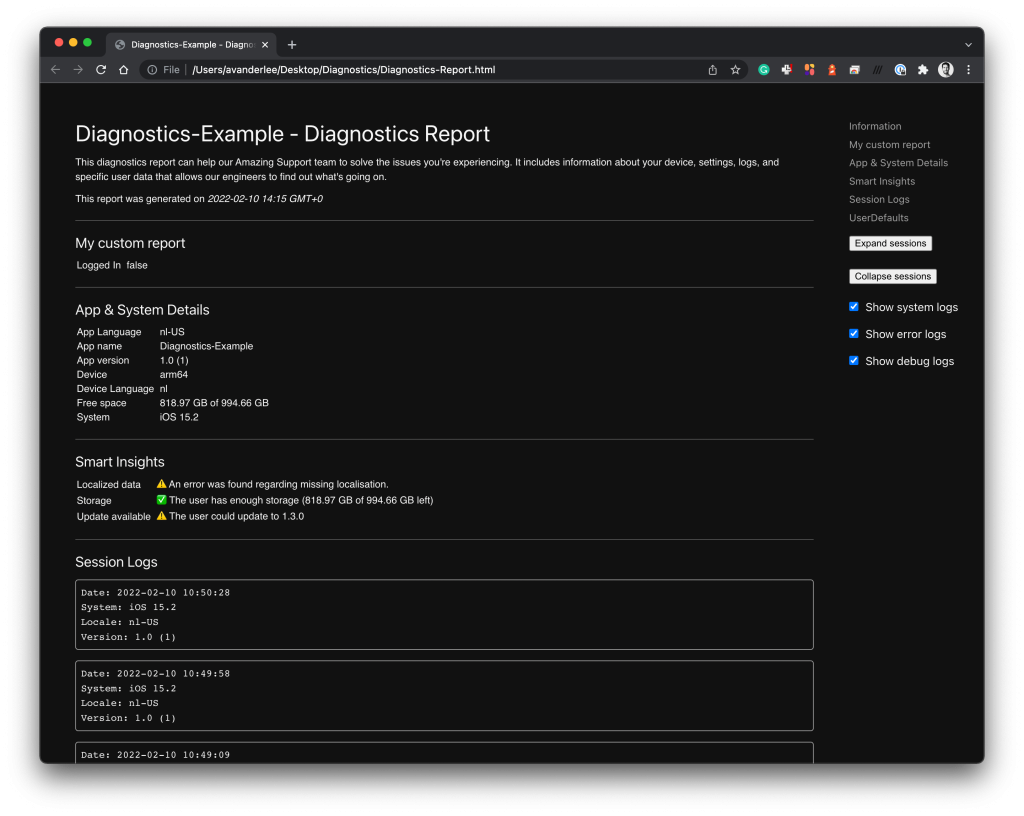
A detailed look at the standard HTML report
The standard HTML report contains answers to common questions, such as the OS and app version. It also provides insights into system details, such as language, storage, and device type.
The session logs are where the real magic happens. You can see this as your Xcode console: it contains all the system and debug logs you’re used to when debugging. This is extremely helpful as a developer, as you can narrow down an issue in detail. The HTML report even offers JavaScript-based filtering of the system logs, so you can directly look into errors:
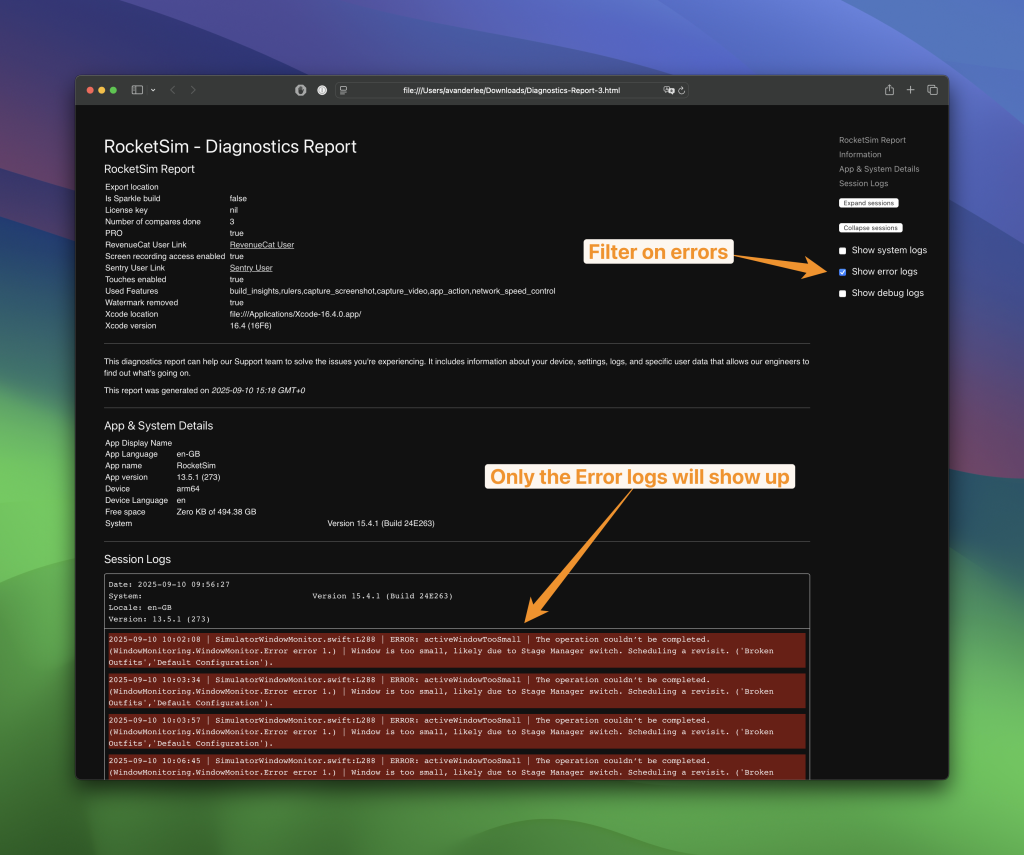
In this case, for RocketSim, I could tell the user we’re not supporting Stage Manager yet. With just one email reply, I’ve been able to inform the user and reference the related GitHub issue.

FREE 5-Day Email Course: The Swift Concurrency Playbook
A FREE 5-day email course revealing the 5 biggest mistakes iOS developers make with with async/await that lead to App Store rejections And migration projects taking months instead of days (even if you've been writing Swift for years)
A better collaboration with your Support team
What’s great about these diagnostic reports is that they’re consistent. Each user who reaches out will provide the same technical information. I’ve been working together with support teams and trained them to read these reports themselves. This is another friction point solved, making the support process more streamlined. The support team does not have to bother developers with each support issue, and developers can maintain their focus and productivity.
Before a support agent reaches out to a developer, they’ve at least ensured users are using the latest app and/or OS version. Known issues related to a specific error log could be detected by a support agent from the session logs. This is a win-win in many parts:
- Users get a better answer, more quickly
- Support agents are less dependent on input from developers
- Developers can stay focused on writing code instead of helping out on support tickets
But that’s not all: we still had to inform support agents of known issues. If your support team is big, this can quickly become cumbersome. Therefore, we’ve introduced a feature called Smart Insights.
Using Smart Insights
Smart insights are basically insights after processing logs. Diagnostics allows you to process each log line and return a Smart Insight accordingly:
struct SmartInsightsProvider: SmartInsightsProviding {
    func smartInsights(for chapter: DiagnosticsChapter) -> [SmartInsightProviding] {
        guard let html = chapter.diagnostics as? HTML else { return [] }
        if html.errorLogs.contains(where: { $0.contains("Window is too small, likely due to Stage Manager switch") }) {
            return [
                SmartInsight(
                    name: "Stage Manager Issue Detected",
                    result: .warn(message: "An error was found regarding missing support for Stage Manager. Inform the user about this if needed.")
                )
            ]
        }
        return []
    }
}
A dedicated report chapter will show up with the Stage Manager issue insight. The support agent no longer has to navigate through all sessions to find out about the user’s issue.
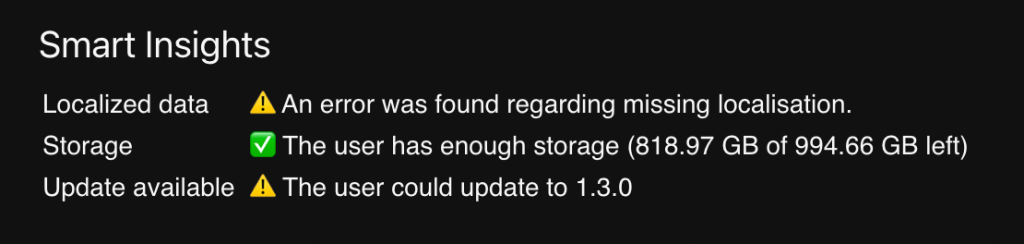
By default, standard Smart Insights are provided:
UpdateAvailableInsightuses your bundle identifier to fetch the latest available app version. An insight will be shown whether an update is available to the user or not.DeviceStorageInsightshows whether the user is out of storage or not
An example smart insights section could look as follows:
Solving user bugs faster using agents
A user diagnostics report becomes even more valuable when an agent can read it directly. Diagnostics 7.0 keeps the same single HTML attachment you could already send to your support team, but now embeds structured JSON data inside the report.
This means your users can still share a report as before, while agents can inspect the underlying data without having to parse rendered HTML. The report contains structured chapters, session metadata, log events, and crash diagnostics. In other words, the information you need to solve a user-specific bug becomes easier to parse and reason about.
An agent skill for parsing Diagnostics
For token-efficient report parsing, I’ve created a dedicated agent skill. This skill knows how to handle HTML reports by reading the embedded structured JSON rather than parsing the rendered HTML. Agents become much more useful when they have access to both your project’s code and the diagnostics report, since they can connect user logs directly to the implementation.
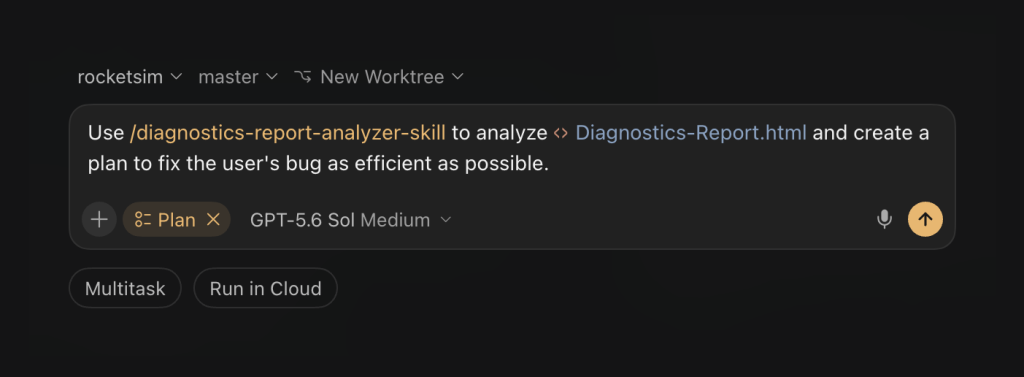
For the easiest setup, install the analyzer skill with npx skills:
npx skills add https://github.com/AvdLee/Diagnostics --skill diagnostics-report-analyzer-skillSee agent-skill-install-instructions.md for Claude, Cursor, OpenAI-compatible tools, pi, and manual installation options.
Exporting as JSON instead of HTML
The default API still creates a user-friendly HTML report:
let report = await DiagnosticsReporter.create()If your support workflow consumes structured data directly, you can create a standalone JSON report instead:
let report = await DiagnosticsReporter.create(format: .json)This allows you to send a user report based on Diagnostics to your custom server or to Linear and attach it to an issue. No need to email the HTML report: you’ll work directly with the structured JSON instead. This makes it a great solution for AI-optimized workflows.
Can I see Diagnostics in action?
Well, you’re an app developer, so I invite you to install RocketSim from the Mac App Store and report an issue from the status bar menu. Diagnostics supports iOS, iPadOS, and macOS.
This is a win-win, as RocketSim offers 30+ utilities for Xcode’s Simulator!
Conclusion
Diagnostics is a game-changer when it comes to offering support in apps. The HTML report provides answers to common questions and reduces friction. As a developer, it’s likely you’ll be less annoyed by support agents. The framework offers much more flexibility, so I would like you to look into the open-source repository’s README.
If you like to learn more tips on debugging, check out the debugging category page. Feel free to contact me or tweet to me on Twitter if you have any additional tips or feedback.
Thanks!