AI Agents change how we develop, and you might think you no longer need Xcode Instruments for performance iterations. When I started developing apps in 2009, we would constantly use Xcode Instruments’ Time Profiler and other instruments to analyze and improve our apps’ performance. Devices were simply much slower, so if you didn’t do it, your apps would die due to memory usage.
Nowadays, we have blazing-fast devices. It feels redundant, and it’s true: it’s less needed. However, I truly believe we can make our apps so much better and more performant if we visit Xcode Instruments regularly. The good news is that you don’t have to do the analysis yourself anymore: AI Agents can help.

Sample Case: 25x faster accessibility elements fetching
AI Agents are great at performance iterations. You can ask them to set a baseline and constantly compare the new results against it. It’s also smart enough to revert changes if they didn’t bring the expected results.
RocketSim’s CLI allows agents to fetch accessibility elements from the Simulator. Agents use them to navigate the Simulator app autonomously. When I started my performance improvements, I had two problems:
- Accessibility elements were missing (e.g. Tab Bar items)
- Fetching elements was terribly slow
As soon as I fixed the first point, fetching became even slower. Fetching took ~12.18 seconds for a screen with 70+ elements. If an agent has to navigate the Simulator, spending 12 seconds per step, it would be a waste of time.
I won’t go into the specifics of what I changed to improve the code, because it will not be applicable to your app. What I can tell you is that I used Xcode Instruments to give AI eyes, allowing it to analyze the code deeply and identify where to make improvements.
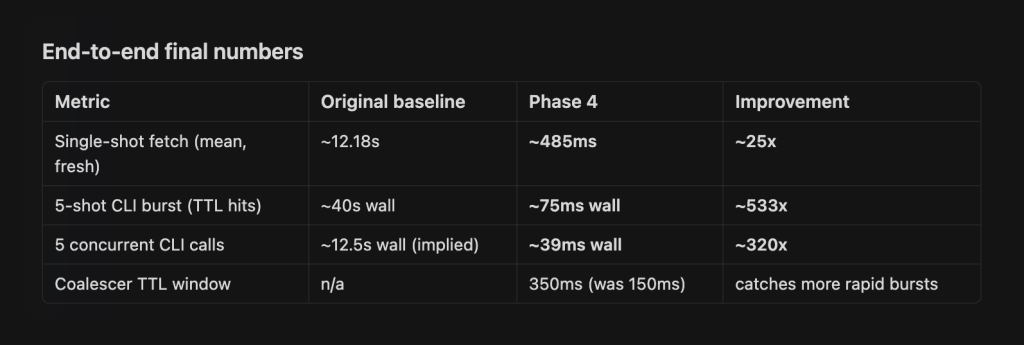
Overall, the phases improved like this:
- Phase 1: 12s → 4s (3x)
- Phase 2: 4s → 2.5s (5x)
- Phase 3: 2.5s → 525ms (23x)
- Phase 4: 525ms → 485ms (25x)
It’s tempting to stop at phase 1, because you would think AI has already done everything it could to speed it up. However, it’s crucial to keep iterating, as new results reveal additional performance improvements.
Adding a CLI to your app
Before we dive into how I use Xcode Instruments and its Time Profiler to give AI insights into your app’s performance, I first want to recommend adding a CLI to your app. Not for production use cases, but for giving your agents an easy way to verify improvements.
I added RocketSim’s CLI for production reasons, not realizing I’d also made my development workflow much better. I could suddenly ask my agents to improve the performance of RocketSim features by making the same features available in the CLI. The agent applies improvements, runs the CLI, and compares the outcome.
Note that the performance of your CLI isn’t the same as the in-app performance, but it does isolate performance benchmarks for the specific methods used in your app.
Using Xcode Instruments with Agents
It’s important to know that a CLI alternative exists for Xcode Instruments:
avanderlee@AJs-MacBook-Pro ~ % xctrace help
usage:
	xctrace <command> [options]

global options:
	-q, --quiet

commands:
	record                                      Perform new recording using specified template
	import                                      Import file of a supported format into .trace file
	export                                      Export .trace file content to an external format
	remodel                                     Remodel .trace using currently installed modelers
	symbolicate                                 Symbolicate .trace file using specified dSYM
	list [devices|templates|instruments]        List capabilities of the current running environment
	version                                     Print version of the tool

further help:
	 xctrace help <command>
I’m currently working on an efficient way to avoid spending all your tokens reading xctrace files. But even then, manually using Xcode Instruments might feel better if you’re used to it.
My flow looked as follows:
- Apply the performance improvements to the agents
- Re-run the app inside Xcode Instruments with the Time Profiler template and an additional signpost instrument
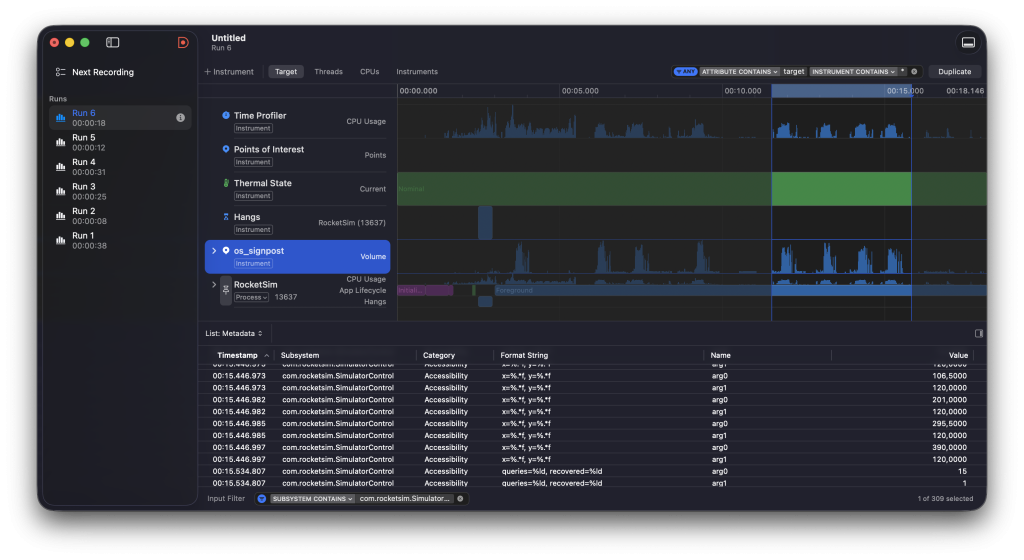
The latter allows you to provide more specific insights to your agents. By adding signposts, your code becomes visible in the signpost instrument:
Of course, you can ask the same agent to add those signposts.
The image above shows that I ran multiple times. These runs represent the different phases I mentioned earlier. The four blue bumps in the signpost graph represent me using RocketSim’s accessibility overlay to fetch the elements four times.
Once done, I would collect the information for the agent:
- I switched from List: Metadata to List: Intervals, selected all rows, and copied them to the clipboard
- I then selected the Time Profiler instrument for the same time range and made a deep copy of the root element
The latter looks as follows:
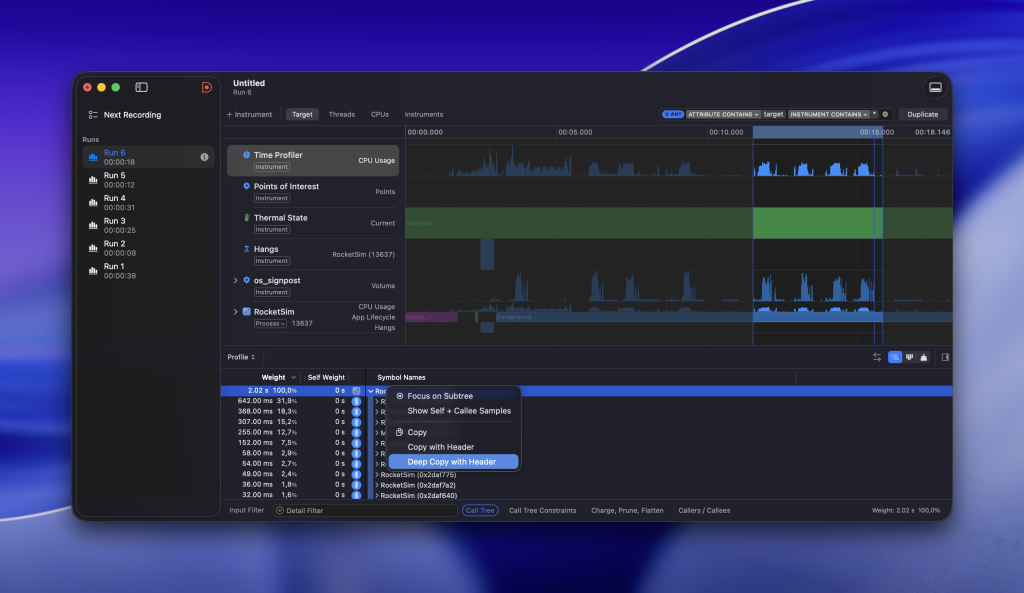
Note that I used the Call Tree filter in the footer to:
- Separate by Thread
- Hide System Libraries
This way, you reduce the output to what matters.
Creating the prompt
Combining both outputs allows you to create a follow-up prompt. I used something like:
I tested the functionality 4 times. Here are the signpost intervals:

<signpost_intervals>

And here are the Time Profiler insights:

<time_profiler_deep_copy>

Analyze and create a new plan for further optimizations.
That would be enough for the agent to analyze the results and propose the next phase of improvements.
Consider your token usage
The above prompt is far from optimized for token usage. Occasionally, I would skip the signposts and shared the time profiler deep copy first. It’s often enough already to come up with performance improvements.
At the same time, the raw output of the deep copy can be significantly optimized. It looks a bit like this:
Weight	Self Weight	Symbol Names
2.02 s  100,0%	0 s	 RocketSim (13637)
642.00 ms  31,9%	0 s	  RocketSim (0x2daf767)
635.00 ms  31,5%	0 s	   partial apply for closure #1 in AccessibilityElementsCoalescer.accessibilityElements(deviceUDID:)
635.00 ms  31,5%	0 s	    closure #1 in AccessibilityElementsCoalescer.accessibilityElements(deviceUDID:)
635.00 ms  31,5%	0 s	     protocol witness for AccessibilityElementsFetchProvider.fetch(deviceUDID:) in conformance SharedSimulatorAccessibilityFetchProvider
While it’s not bad, it can definitely be optimized a lot. That’s why I’m working on a new CLI command for RocketSim where you can start a performance trace, run your reproduction path in the Simulator either manually or automatically, and stop the performance trace to get the above results in an optimized format. If you want to stay updated on this progress, I highly encourage you to sign up for RocketSim’s email list by using the form at rocketsim.app.
Iterate and improve
The above cycle was repeated for every optimization phase. Eventually, the performance was good enough to stop considering another iteration. An agent will likely tell you as well: there is no way to make your code faster than this.
Conclusion
Xcode Instruments Time Profiler can be a great way to optimize your code using AI agents. By creating a performance optimization plan based on a deep copy prompt, your agent will be able to connect the project’s code to actual performance insights and improve accordingly. Repeating this flow can yield significant performance gains.
These workflows are just the beginning and a subset of what I’ll train in my dedicated course. I’d love to welcome you to it: Agentic coding fundamentals for developers.
See you there?