App Store Optimization is important for every app’s success. You’ve spent a lot of time building a fantastic product, so you’d better get it in front of as many potential users as possible. Yet, it’s a whole different paradigm; it requires different knowledge and tools.
I’ve been here myself, and today, I’m sharing my personal journey of improving RocketSim‘s App Store presence. This will especially be focused on how I changed my App Store screenshots and how I measured the impact of the changes inside App Store Connect.

What is App Store Optimization (ASO)?
App Store Optimization (ASO) means improving your app’s metadata to get more impressions and downloads as a result. You can compare it to Search Engine Optimization (SEO) by meaning, but it has a whole different set of rules and effects.
In general, you’ll focus on optimizing the title, subtitle, keywords, screenshots, and description of your app. Several tools allow you to track the performance by showing how well you rank for a certain keyword.
How to track the performance using App Store Optimization tools?
While there are many different tools out there, I’m just sharing my personal experience here. Good friend Ariel from AppFigures shares many great tips on YouTube and X, but you’re best off by reading a good amount of their ASO guides. Other tools, like ASO Suite, work similarly and provide a way to track a set of keywords.
I always like to start by asking myself:
- What keywords will my target audience likely use to find an app like mine?
- Which search terms are used by my target audience?
It’s impossible to tell you all the best practices in this single article, but coming up with a good list of keywords to start with should be possible with the above two questions. For RocketSim, here are a few keywords that made sense:
- Developer tool
- Apple Developer
- Xcode
RocketSim is a developer tool for Apple Developers that makes use of Xcode. Do you see what I did there?
I explain RocketSim and it results in a few great keywords.
But how do I know whether these keywords actually make sense?
That’s where tools come into place. You’ll have to do your research to see whether keywords are actually used by your target audience. In my case, I know for sure my audience is looking for keywords like Xcode. I’ve also noticed it’s not that crowded in this section of the Mac App Store.
Can I also track the performance without any tools?
Yes, you can. In fact, I like to search for my app manually in the App Store and validate whether it appears for a given keyword. Here’s an example of searching for xcode in the Mac App Store:
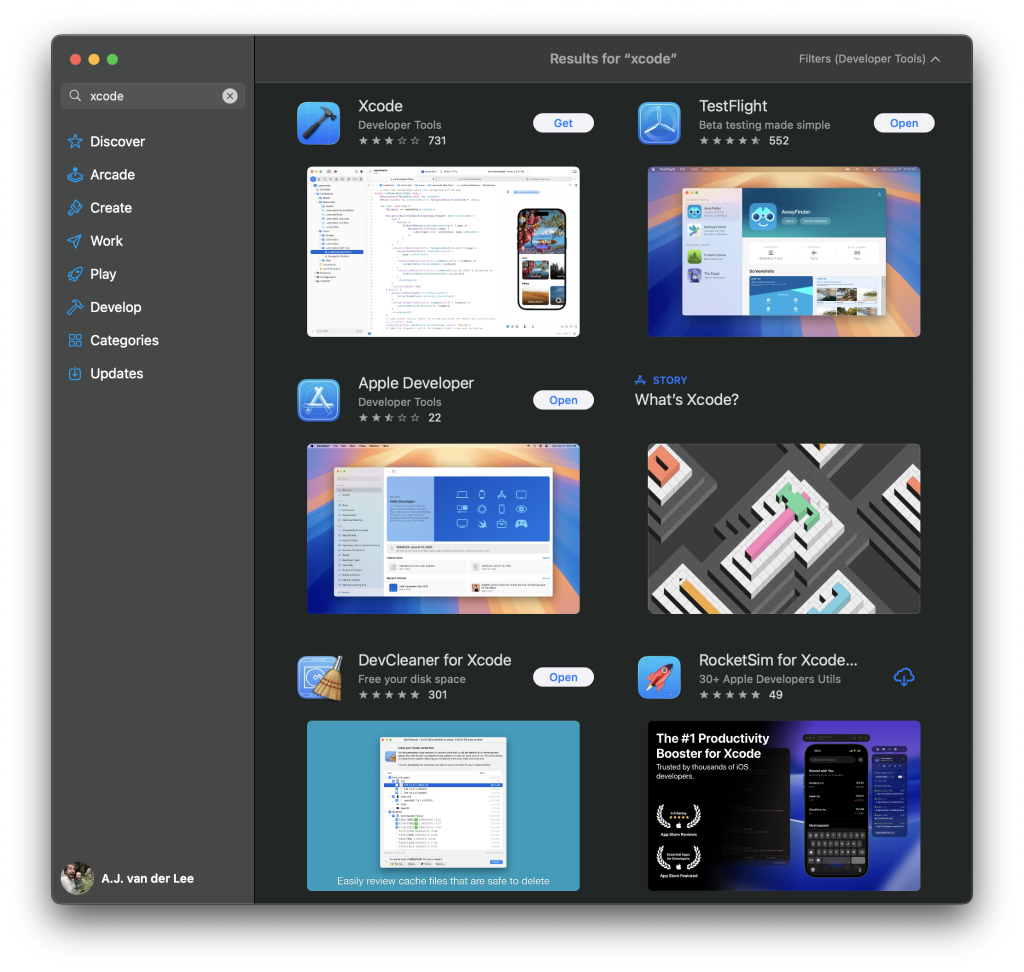
As you can see, RocketSim shows up in the bottom right corner. It’s not listed in the first place, but that has a few reasons:
- The more users who download your app after searching for Xcode, the more relevant your app becomes for that keyword
- Since RocketSim isn’t Xcode, it makes sense it’s at least not ranked first
Yet, I’ve increased chances of being noticed by the correct target audience, and that’s what matters most for me for this keyword.
FREE 5-Day Email Course: The Swift Concurrency Playbook
A FREE 5-day email course revealing the 5 biggest mistakes iOS developers make with with async/await that lead to App Store rejections And migration projects taking months instead of days (even if you've been writing Swift for years)
Tracking ASO performance in App Store Connect
While there are many (paid) third-party tools available, I also like to look into App Store Connect analytics frequently. Apple provides us with a lot of insights free of charge, and they’re a great way to get an idea of performance improvements.
But before we dive into a real-world example, I want to bring you up to date on the App Store metadata changes that I’ve applied.
App Store Optimization Example: RocketSim
Here’s how I would describe RocketSim:
RocketSim is a developer tool for Apple developers that makes use of Xcode. It offers 30+ utilities, and teams like Meta, Runkeeper, and Strava use it. Over 200+ teams have been using RocketSim so far, and they mention building apps up to twice as fast when using RocketSim.
Yet, a lot of these things where not at all clear from any of the App Store’s metadata. This was quite a surprise to me—the main way of me selling RocketSim to a user is not reflected in the App Store. In other words, I’m not optimized for explaining RocketSim’s true value!
For example, I did not optimize my subtitle well enough. I’ve changed it as follows:
- Before: Build Apps with 30+ plugins
- After: 30+ Apple Developers Utils
The keywords ‘Build’ and ‘Apps’ are great, but not often used in the App Store as search terms. The new subtitle ranks for a critical keyword (Apple Developer), and it’s extra powerful because it speaks directly to the exact target audience. If you’re an Apple Developer, you will be triggered by reading that subtitle.
Understanding the concept of scan & hook
I like to think about the App Store as a page that’s being scanned by a potential user. At any time, you need to hook the user into reading more about your app. This starts at the first impression and continues into your product detail page.
- The title of your app is the first scanned copy, it hooks a user into reading more: the subtitle
- The subtitle shares a bit more information and should hook a user into looking at the screenshot
- The first screenshot takes over and should convince the user to click forward
This is an example sequence, and the order may differ; however, it’s essential to understand that each part of your app’s metadata can impact scan & hook behavior. I’ve emphasized first when talking about screenshots, since there’s a key point to understand:
Why the order of screenshots matter
On iOS, the first three screenshots are visible. on macOS, only the first. In other words, these are your app’s most important screenshots! They’ll get the most impressions, they will have the highest potential of converting a user into clicking forward into your product detail page.
On macOS, the product detail page will only show the first 2-3 screenshots. These need to be optimized!
Remember the explanation I shared about RocketSim before? The first three screenshots should share the same story. Yet, these where my screenshots before the improvements:
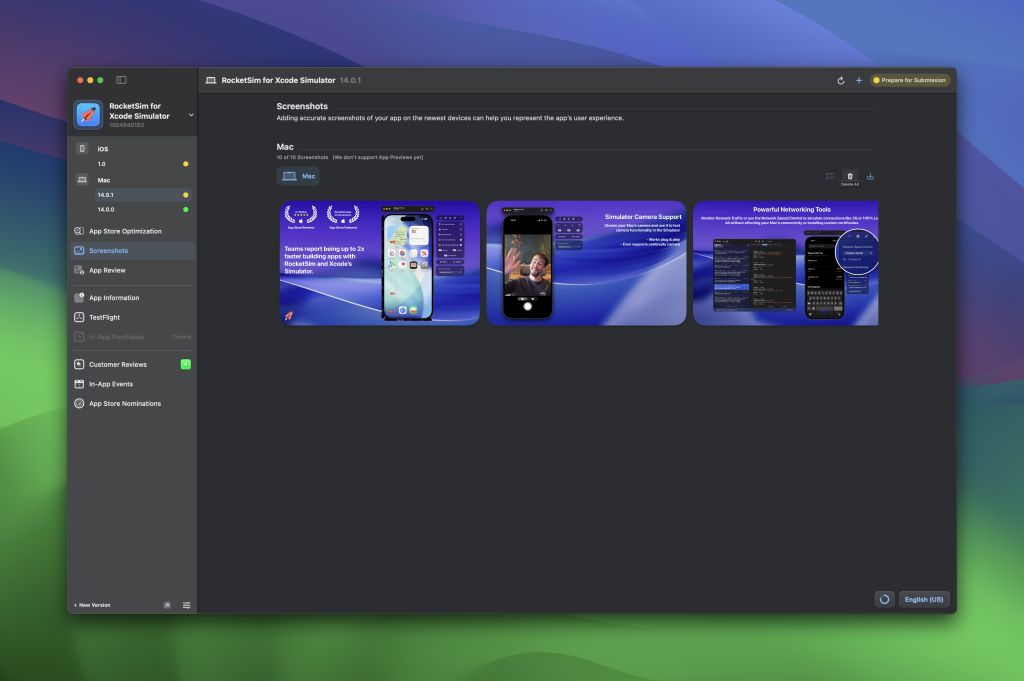
Note that I’m using Helm here, a great app for optimizing and updating your app’s metadata.
I’ve kept the screenshots small on purpose, since it gives you as a reader of this article the idea of scanning—you quickly look at a page and don’t see all the details until you truly focus. With that in mind, have a look at the improved screenshots:
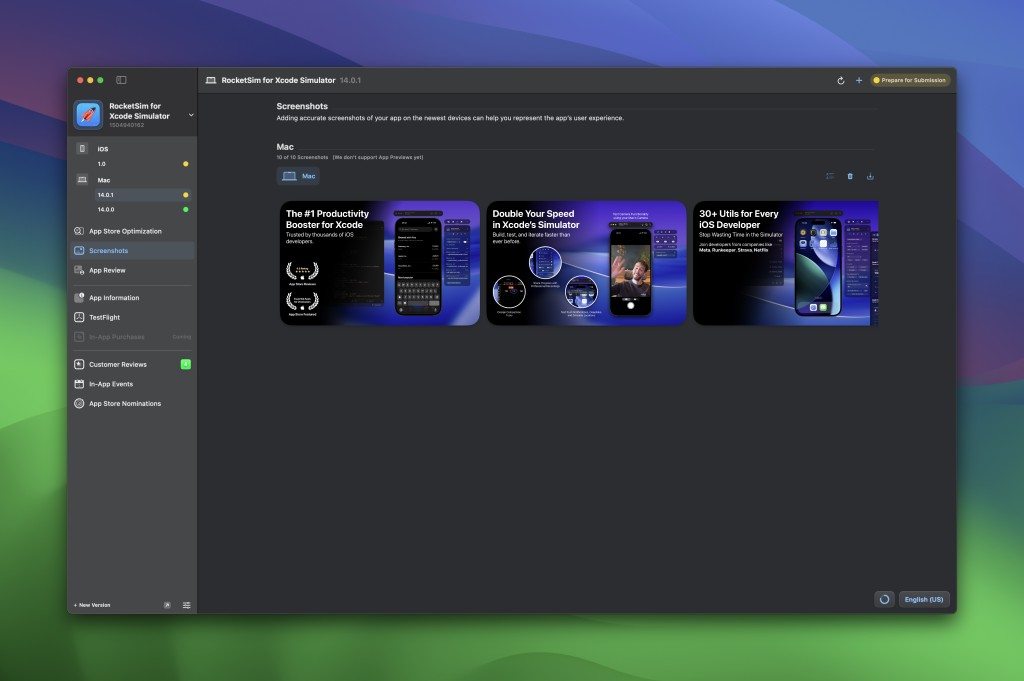
Do you experience the difference?
Even though the images are small, the copy is still readable. On top of that, there are several improvements:
- The design feels more cohesive
- The titles of each screenshot share the unique added value of RocketSim
- The user gets a sneak peak in some of the features, but it invites to learn more
Although it’s harder to read in the above screenshots, I’ve also enhanced the metadata for each screenshot. I added a consistent space for a subtitle, which is used to explain RocketSim’s story better. While I’d love to add all the screenshots in this article, it’s a much better experience to look at the improved screenshots in the Mac App Store yourself.
Using App Store Connect analytics to monitor improvements
You’re right, we were here to talk about App Store analytics. I wanted you to be aware of the same context that I have before we dive into numbers and improvements.
When I started this experiment, I wrongly concluded App Store Analytics wasn’t useful. When I looked at many of the charts, I had a hard time accepting daily averages instead of totals for a given period. For example, I would set the range of data to September, looking for the total number of impressions and downloads so I can compare these absolute numbers to a previous period.
When App Store Connect didn’t provide me absolute numbers, I started to wonder: is that for a reason?
Why you shouldn’t look at absolute numbers
When analyzing your App Store performance, absolute numbers can be misleading. Looking at totals across a time period makes longer ranges automatically look “better,” even if daily performance hasn’t improved. This is why App Store Connect emphasizes daily averages: they normalize data, making it easier to compare a 7-day campaign with a 30-day one, spot actual trends in impressions, and benchmark performance consistently across different metrics.
By focusing on averages instead of totals, you get a clearer view of whether your app is truly gaining momentum rather than being blinded by inflated raw numbers.
First-time vs. Total Downloads
Another struggle I had was looking at the conversion rate App Store Analytics provides. It’s based on the total downloads, which also includes re-downloads. At first, I thought I should only look at first-time downloads since these are unbiased users. However, what if my improvements resulted in returning users being re-convinced to download RocketSim? That’s also a result of App Store optimization.
The importance of applying a proper source type
When doing App Store metadata improvements, you need to ensure you’re actually measuring the impact of these changes. In App Store analytics, you’re looking at all data by default. This includes impressions and downloads from users that source from a web referrer.
These could be users who visited your app’s website or found a demo video on YouTube. In other words, these are biased users who already know more about your app. They might visit the App Store to directly download the app as they’re already convinced. Your App Store metadata won’t be a differentiator in the user’s decision to download the app. (Important note: Poor App Store metadata could still lead to these users churning.)
My hypothesis when looking at App Store Analytics is to focus on source type App Store Browse. If metrics for these users improve, I’m convinced metrics for other sources will improve as well. In the end, I’m able to better convince cold users who aren’t familiar with RocketSim yet to download the app. If I’m able to convince them, I should be able to convice users with more background information as well.
It’s not all about impressions
You might be tempted to start celebrating a growth in impressions. However, impressions don’t matter if these are the wrong impressions. Imagine RocketSim ranking very well for Android, resulting in thousands of extra impressions. Do you think it will lead to more iOS developers using RocketSim?
You have to make sure you gain impressions for the right target audience. You can ensure this by:
- Optimizing your App Store metadata for relevant keywords
- Ensuring impressions improve ánd product page views + downloads improve
So, how well did your RocketSim improvements work Antoine?
Great question! At the moment of writing, it’s been one week since the improvements went live. Ideally, I would’ve written this article a few weeks later to show you a better overall impression of the improvements. However, the first signs were so positive, that I’m more than conviced to write this article today.
I had set myself the following goals of improvements:
- Grow the Daily Average Unique Device Impressions by 10% from 998 to 1098
- Grow the Daily Unique Product Page Views by 30% from 39 to 51
- Grow the Conversion Rate by 27% from 0.72% to 0.92%
A few important notes to these goals:
- Source type for measuring is always set to App Store Browse
- I’ve tried to set targets that are a stretch—I believe they’re challenging to achieve. This is mostly feeling based, but the more experiments you do, the better you get at determining realistic goals.
- While I mention absolute numbers, I actually look at the relative % of improvement. E.g. If the new Daily Average Product Views absolute number is lower than 51, but the conversion from impression to page view improved, it’s still a success.
Once again, absolute numbers are impacted by momentum. Your conversion, your scan → hook → conversion, that’s what truly matters when optimizing App Store metadata.
A look at the results after one week
So, let’s have a look at the results after one week:
- Daily Average Unique Device Impressions
Target improvement: 10%
Actual improvement: 30% - Daily Unique Product Page Views
Target improvement: 30%
Actual improvement: 108% - Conversion Rate
Target improvement: 27%
Actual improvement: 42%
These are crazy improvements! Though there’s an important note to make: macOS Tahoe was released last week, and RocketSim could have been featured. I have no sign at all that it has been featured, but it’s an important lesson to share at this point: the App Store Browse source type can be impacted by App Store featuring.
So, I’m not celebrating these results yet, unfortunately. However, the first signs are good, and I will keep monitoring the results for a few more weeks until they settle to a good average. A good way to do this is by looking at a more extended period of data:
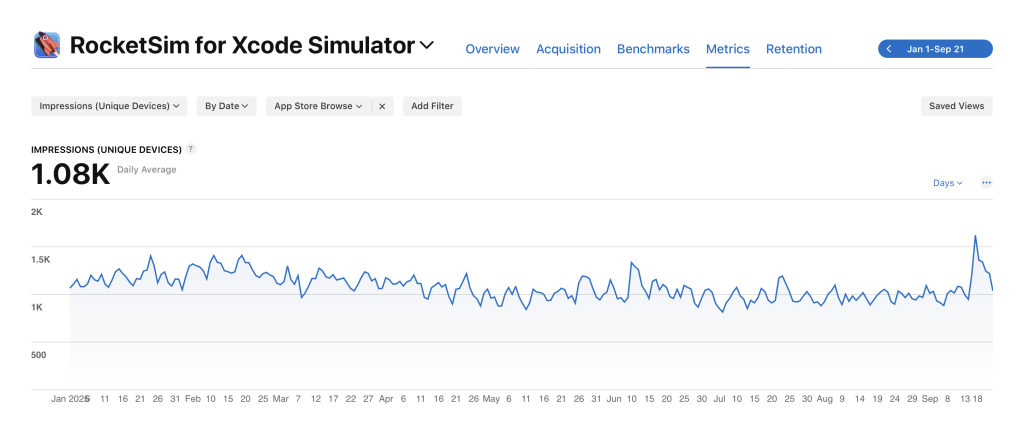
You can clearly see the spike at the moment of the ASO improvements release, but it’s also the macOS Tahoe release date. The impressions slow down after, so I’m keen to see where results will settle. I’m convinced that I can conclude on improvements in a few weeks from now, when I exclude the spike of the first week.
Conclusion
App Store Optimization is an important part of an app’s success. Several App Store tools allow you to optimize, but Apple’s App Store Connect analytics can also be an excellent source for measurement. You need to make sure you optimize your metadata for the right target audience to ensure better results after conversion.
If you’re keen on increasing in-app conversions too, I highly encourage you to read my article App onboarding funnel optimization to increase conversions.
Thanks!