OSLog is a replacement for print, and NSLog and Apple’s recommended way of logging. It has different logging levels, like debugging, warning, and error logs. Altogether, it allows you to create an enriched logging experience fitting nicely in Xcode 15’s new logging console.
OSLog has a low-performance overhead and is archived on the device for later retrieval. You can read logs using the external Console app or benefit from structured logging directly inside Xcode 15. Altogether, obtaining structured logging via OSLog is far better than using print statements.

Setting up Structured Logging
WWDC 2020 introduced improved APIs that make it even easier to work with OSLog. The APIs look much more similar to popular frameworks like CocoaLumberjack and are better aligned with other Swift APIs.
Using a Logger instance
We start by creating a Logger extension to configure the categories for our app. It’s recommended to create a category for each part of your app to optimize your logging structure for filtering.
import OSLog

extension Logger {
    /// Using your bundle identifier is a great way to ensure a unique identifier.
    private static var subsystem = Bundle.main.bundleIdentifier!

    /// Logs the view cycles like a view that appeared.
    static let viewCycle = Logger(subsystem: subsystem, category: "viewcycle")

    /// All logs related to tracking and analytics.
    static let statistics = Logger(subsystem: subsystem, category: "statistics")
}
Each logger instance requires a subsystem and category name. I recommend using the bundle identifier as a unique identifier for your subsystem that is recognizable when filtering logs inside the Console app.
Once configured, you can start logging using one of the different log-level methods:
Logger.viewCycle.info("View Appeared!")Logging properties using String Interpolation
OSLog supports string interpolation and string literals, just like you’re used to when using print statements. For example, we can print the username as follows:
let username = "Example Username"
Logger.viewCycle.info("User \(username) logged in")
Setting the right privacy level
When implementing logging, you need to consider data privacy. In the above example, we’re printing out the username, which would be better to keep private. We can mark the username’s privacy level using string interpolation:
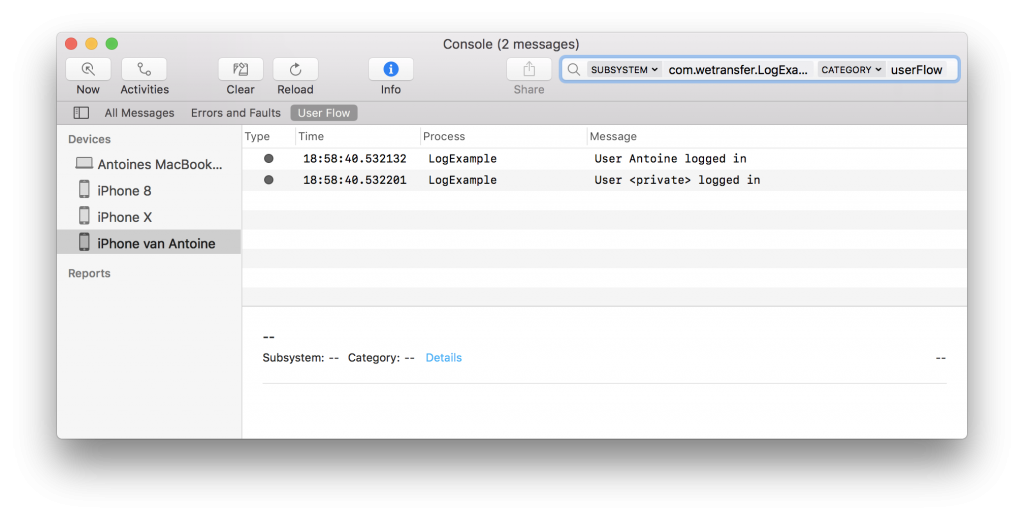
Logger.viewCycle.info("User \(username, privacy: .private) logged in")External applications like the Console app will no longer be able to read the username while still being able to see “User logged in” as a log entry.
Realizing logs will be readable from the Console app for published apps is essential. Therefore, carefully consider the privacy level of logs containing sensitive data.
Optimized logging structure using alignment APIs
There can be cases in which you would like to adjust the alignment of your logs to improve readability. Especially when you’re logging multiple values in a line, it can be helpful to apply table formatting.
For example, the following log statement would not be nicely aligned if printed out without any formatting:
func log(_ person: Person) {
    Logger.statistics.debug("\(person.index) \(person.name) \(person.identifier) \(person.age)")
}

/// [statistics] 14 Antoine 8DA690DD-5D97-4B53-897A-C2D98BA0440D 17.442274
/// [statistics] 54 Jaap 31C442DC-BA95-49D3-BB38-E1DD4483E124 99.916344
/// [statistics] 35 Lady 879378DB-FF29-460A-8CA4-B927233A3AA9 93.896309
/// [statistics] 97 Maaike E0A5396E-2B82-4487-86D5-597A108AE36A 9.242964
/// [statistics] 96 Jacobien BC19603E-B078-4DFB-AE36-FD7592FB2E49 59.958466
You can see that the identifier is aligned directly after the name, which results in jumping alignments if the names aren’t the same length.
We can fix this by using alignment APIs:
func log(_ person: Person) {
    Logger.statistics.debug("\(person.index) \(person.name, align: .left(columns: 10)) \(person.identifier)")
}

/// [statistics] 42 Antoine    71C6B472-6D90-45D2-A7B4-AA3B5A0FE10F 17.442274
/// [statistics] 55 Jaap       6991D0A2-D755-4527-9512-EDE0D431F460 99.916344
/// [statistics] 35 Lady       66129DE6-E874-4854-B2E0-00BBDB2A5FBB 93.896309
/// [statistics] 62 Maaike     D1984459-B67A-44BE-AC83-A43E6460C1E1 9.242964
/// [statistics] 83 Jacobien   24CD3087-91C2-4229-A337-B190D69461BA 59.958466
This improves readability and can help you to digest lots of logs more quickly.
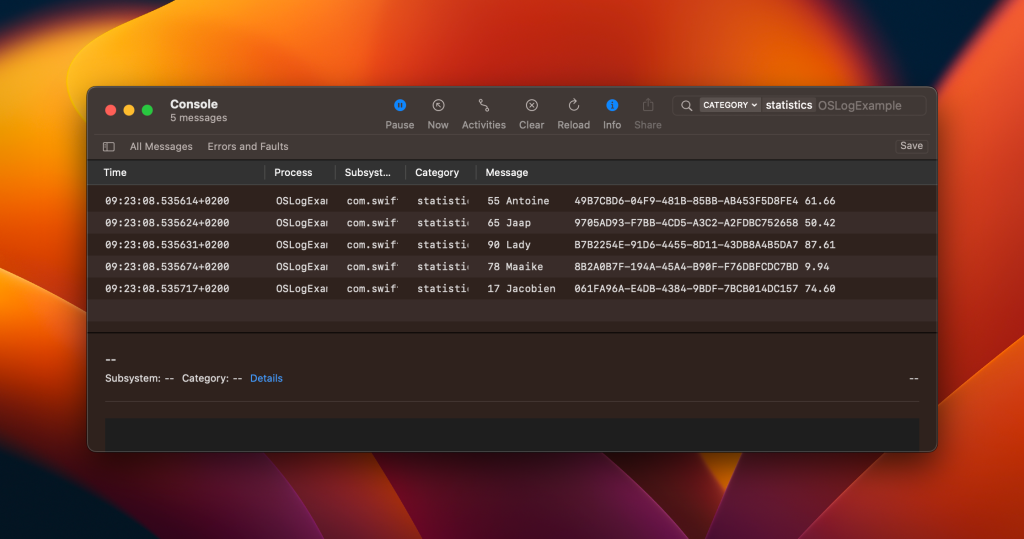
Lastly, we can format the age to only show two decimals by using the new formatting string interpolation method:
func log(_ person: Person) {
    Logger.statistics.debug("\(person.index) \(person.name, align: .left(columns: Person.maxNameLength)) \(person.identifier) \(person.age, format: .fixed(precision: 2))")
}

/// [statistics] 95 Antoine    F205DD9C-C92A-4B48-B27A-CF19C6081EB3 85.33
/// [statistics] 84 Jaap       C55C3F42-5C02-43E0-B416-2E0B7356A964 88.70
/// [statistics] 58 Lady       FD25FB54-51CA-4D6D-805E-547D29D5AE34 38.30
/// [statistics] 69 Maaike     4FDE8D73-ECBF-4015-AE5F-2AED7295D6B2 9.72
/// [statistics] 86 Jacobien   E200351B-920F-4351-9752-212912B42ECB 69.23
Note that Xcode 15 currently doesn’t support this kind of formatting. However, you will be able to see it applied inside the Console app:
Log levels
OSLog’s several logging levels exist to categorize different logging messages. The Console app and Xcode’s debugging console offer filters based on these log levels.
- default (notice): The default log level, which is not really telling anything about the logging. It’s better to be specific by using the other log levels.
- info: Call this function to capture information that may be helpful, but isn’t essential, for troubleshooting.
- debug: Debug-level messages to use in a development environment while actively debugging.
- trace: Equivalent of the debug method.
- warning: Warning-level messages for reporting unexpected non-fatal failures.
- error: Error-level messages for reporting critical errors and failures.
- fault: Fault-level messages for capturing system-level or multi-process errors only.
- critical: Functional equivalent of the fault method.
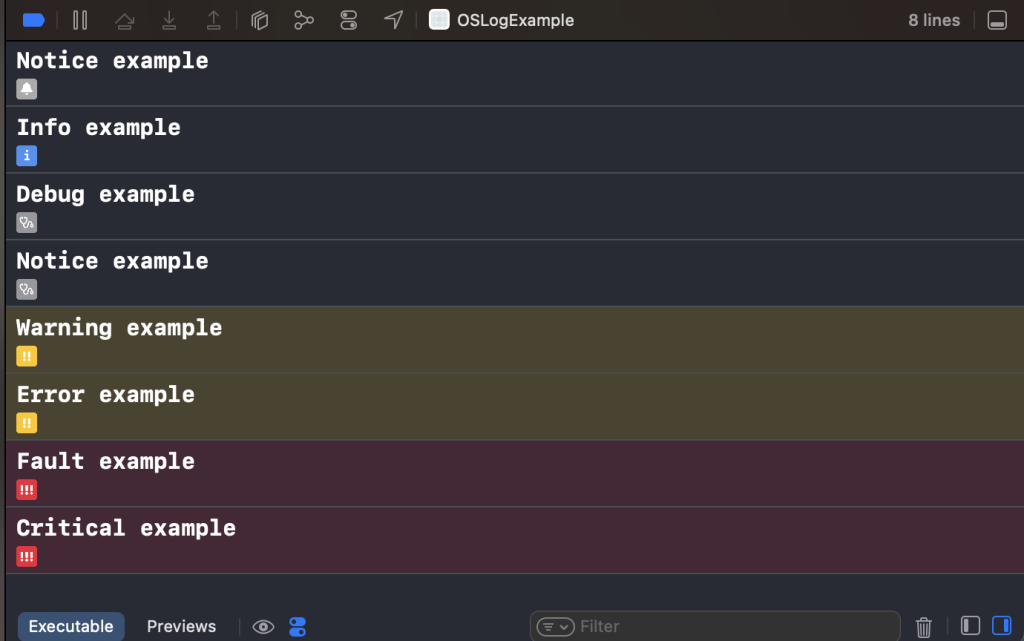
Each log level has a matching logger method:
Logger.viewCycle.notice("Notice example")
Logger.viewCycle.info("Info example")
Logger.viewCycle.debug("Debug example")
Logger.viewCycle.trace("Notice example")
Logger.viewCycle.warning("Warning example")
Logger.viewCycle.error("Error example")
Logger.viewCycle.fault("Fault example")
Logger.viewCycle.critical("Critical example")
The output differs per level to help you differentiate inside Xcode’s console:
Reading logs with the Console.app
If you can’t use Xcode’s debugging console, I recommend using the Console.app combined with OSLog to get the most out of this way of logging.
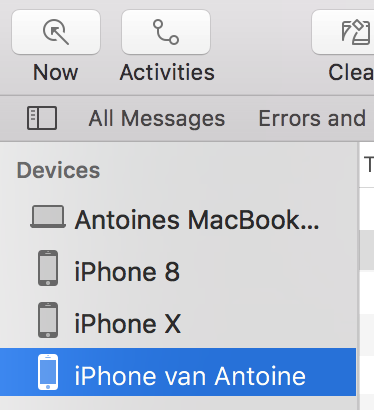
Start by selecting your device on the left in the devices menu. Simulators and connected devices will show up in this list.
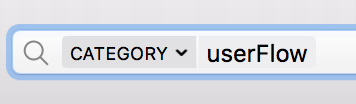
After selecting your device you can start entering a keyword in the search field, after which an option appears as any inside a drop-down menu.
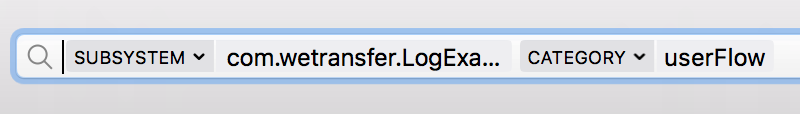
This is the place in which you can filter on your category:
We could go even further if this isn’t enough filtering by passing in the subsystem:
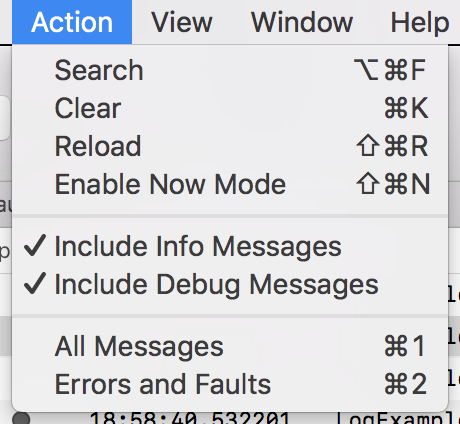
Make sure to include info and debug messages by enabling them from the action menu, so all your messages show up:
You should now be able to get started with reading logs inside the Console.app.
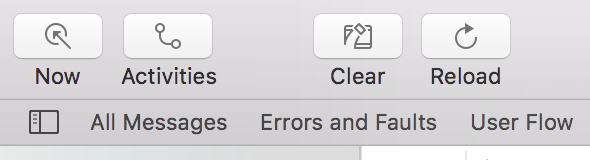
Saving search patterns
To make your workflow faster, you can save your most common search patterns. They will end up in the subheader to quickly filter out logs and start debugging efficiently.
I’ve used this technique to debug common issues on colleagues’ devices.
Further reading
WWDC often includes dedicated sessions to logging, including performance logging APIs. You can watch the sessions here:
- Measuring Performance Using Logging (WWDC 2018)
- Explore logging in Swift (WWDC 2020)
- Debug with structured logging (WWDC 2023)
For more in-depth documentation, check out the Apple docs on logging.
Conclusion
OSLog is the future of logging in Swift and an excellent replacement for commonly used print statements and comes with several advantages, like reading out logs from the Console app and low-performance overheads.
If you like to learn more tips on debugging, check out the debugging category page. Feel free to contact me or tweet to me on Twitter if you have any additional tips or feedback.
Thanks!