The Derived Data folder is one of the most important directories an iOS developer relies on. While you don’t work with it directly, Xcode is using it heavily to cache information and optimize the developer experience.
Yet, there are many opportunities for iOS engineers to maximize the benefits of Derived Data. Whether it’s deleting files for build optimization or peeking into directory details, all these actions can enhance the developer’s experience. Let’s dive into 5 things iOS developers do wrong.

That’s a great moment to discuss with your manager upgrading the whole team to the latest MacBook.
1. Not understanding what the Derived Data directory is for
Firstly, it’s essential to be aware of the Derived Data folder. While you can build apps without knowing it, I still believe there’s added value in understanding what it does.
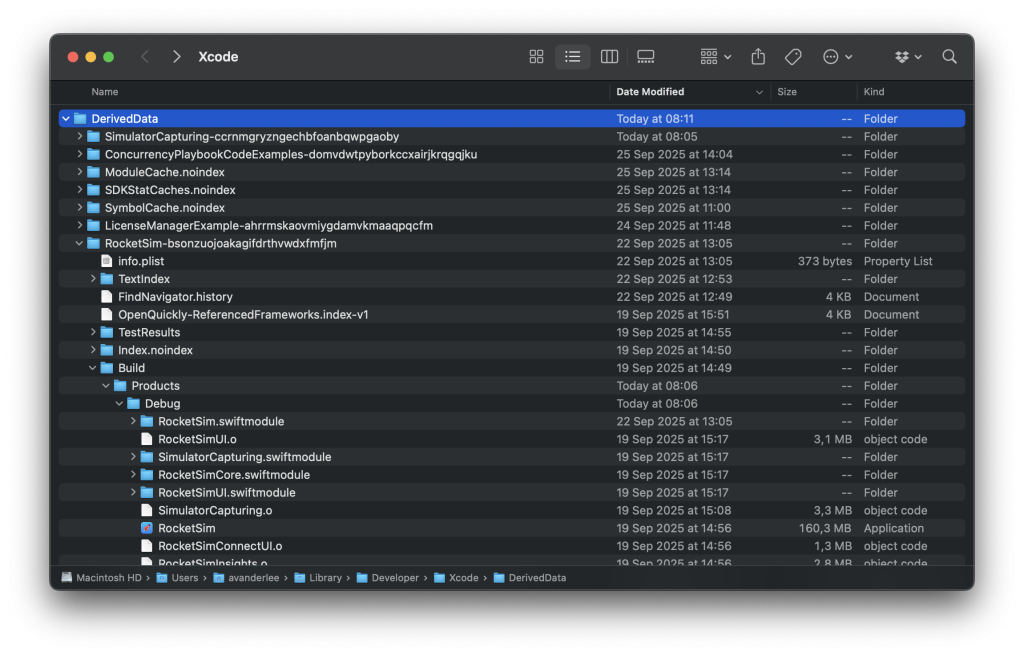
As you can see in the above screenshot of my derived data folder, there’s a lot of data that might not immeditialy ring a bell. I personally recognize project names like SimulatorCapturing and RocketSim, and there are three noindex directories.
These ModuleCache.noindex, SDKStatCaches.noindex, and SymbolCache.noindex directories are ones you won’t touch. Occasionally, I’ve seen them influencing Xcode or the Simulator’s behavior; after deleting these directories, the issue was resolved. However, most of the time, you can solve problems using the other Derived Data directories.
So, which directories are useful? That’s something we’ll dive into later.
2. Manually looking up the Derived Data folder
Another common mistake is that iOS developers try to open the Derived Data folder manually. If you can’t find it easily, you won’t use it often!
Xcode offers an easy way to navigate to the directory by going into Settings → Locations:
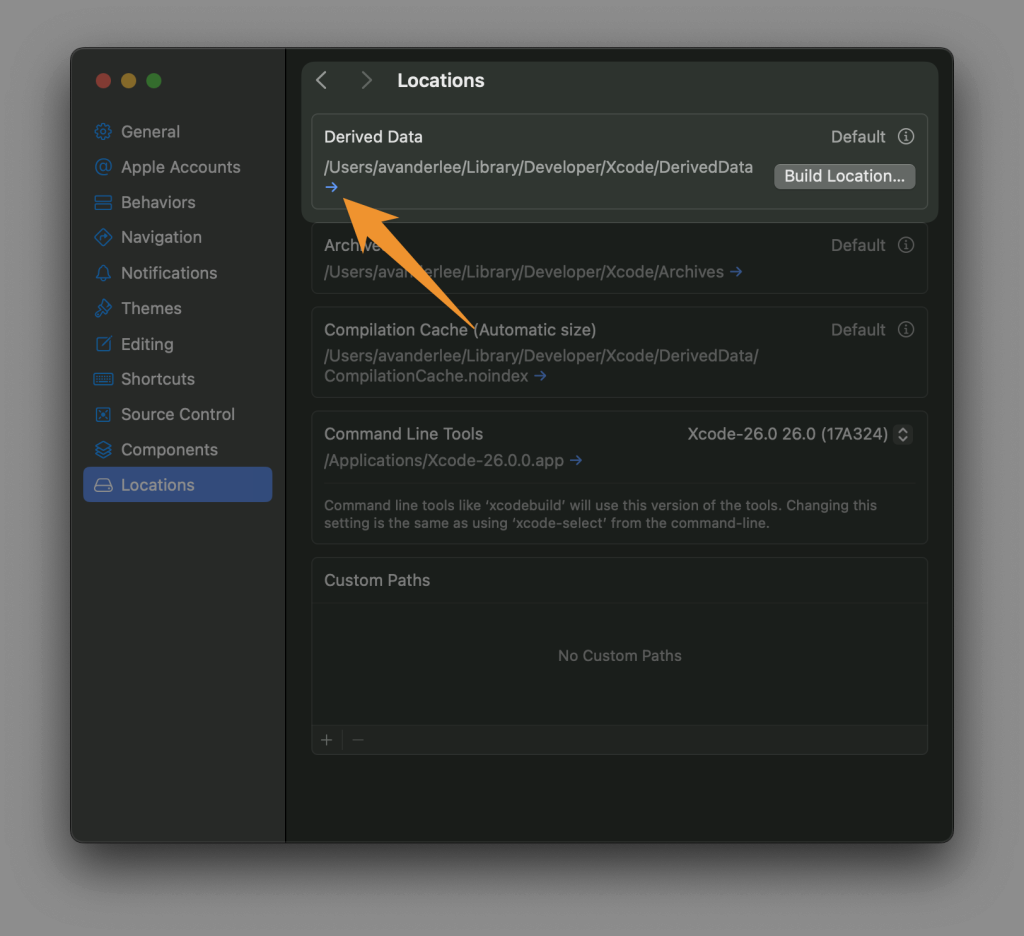
The little blue arrow is actually a button that you can click. After doing so, you will open the directory inside Finder accordingly.
FREE 5-Day Email Course: The Swift Concurrency Playbook
A FREE 5-day email course revealing the 5 biggest mistakes iOS developers make with with async/await that lead to App Store rejections And migration projects taking months instead of days (even if you've been writing Swift for years)
3. Deleting all Derived Data folders when Xcode gets confused
I bet many iOS developers are familiar with this, but if you’re not: deleting the derived data folder is part of a common debugging strategy.
When your app does not build or runs with runtime issues, you’re best of trying these 3 steps:
- Reset the Simulator’s settings
- Run a clean build inside Xcode
- Delete the Derived Data folder
You’ll start in a clean state after this, most likely solving your issues. If it doesn’t solve your issue, it will at least show a clearer error message on what’s wrong.
The key part is that many iOS engineers delete the whole derived data folder. To understand why this is wrong, I’ll explain you how things work.
Each Xcode project has its own derived data folder. It stores information to improve build speed and reduce loading time for Swift packages. In other words, if you delete your project’s folder, you’ll need to compile from scratch and reload all your Swift packages.
In the event of an issue with an individual project, ensure that you only delete the derived data folder for that specific project. Otherwise, you’ll have to rebuild all your other projects from scratch, too, even though there might not have been anything wrong there.
4. Not using advanced build insights
iOS teams should totally benefit from this. Xcode provides a lot of build information in it’s build overviews interface. However, it’s isolated to your local machine and who actually often peeks into it?
When working in teams, it’s beneficial to know the details about your build performance.
Think about it: If your build becomes 5 seconds slower and:
- You’re in a team of 20 iOS engineers
- Each engineer builds the project about 100 times per day
That would mean your team suddenly waits almost 3 hours more per day for builds to complete.
This is why it’s essential to set up metrics for your build times. It’s a silent productivity killer, especially when projects become increasingly complex.
Xcode’s Derived Data folder contains a build logs directory at Derived Data → <project folder> → Logs → Build. There are open-source solutions to parse this data into HTML pages, like XCLogParser. However, it’s much more efficient to use a prebuilt tool.
Using RocketSim’s Team Build Insights
RocketSim is an iOS Developer Tool that adds 30+ utilities to Xcode’s Simulator. Teams report being up to 2 times faster after using it, and part of the reason is that they can keep an eye on their build performance.
RocketSim runs on each developer’s local machine and keeps track of your build durations per project’s scheme. It syncs this build information with its backend, bringing together local Xcode build durations for each iOS engineer.
Instead of using CI to monitor build times, you’re now able to monitor the real-world.
- Every iOS engineer could have a different MacBook setup
- A difference in environment can influence local build performance
Knowing these metrics reveals that the latest MacBook could make your whole team 10% faster. This could justify the investment in upgrading a whole team’s machine.
Here’s an example dashboard overview for one of my apps:
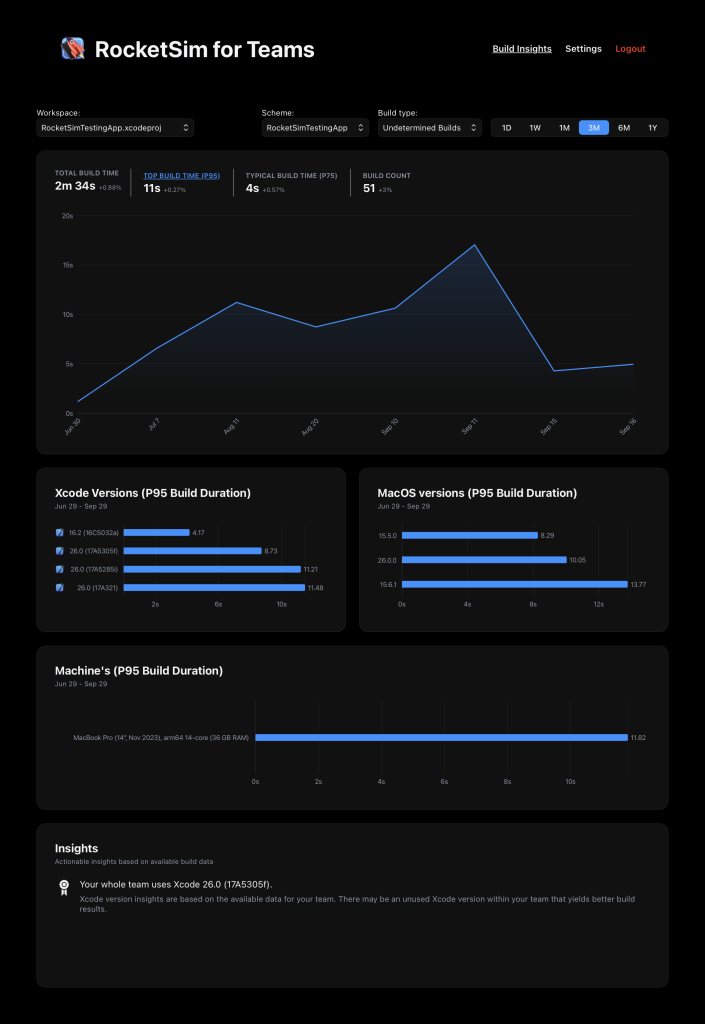
The dashboard shows information like:
- The Top Build Time (p95) and Typical Build Time (p75)
Typical build times represent the majority of the builds done by your team. - A difference between clean and incremental builds
Optimizing for incremental builds is more effective since these are the most common. - Insights into Xcode and OS versions used
A new Xcode or OS can impact build performance.
Imagine this: A new colleague joins the team with a brand new machine. They upgrade to the latest Xcode and OS version, and your dashboard shows that build performance improves drastically. That’s a great moment to discuss with your manager upgrading the whole team to the latest MacBook.
The best thing is that you can start a free 14-day trial with your team.
Here’s what Max Godfrey, an iOS Developer at Tilt, had to say:
“RocketSim Team Insights finally gives us visibility into our build times beyond just gut feeling. We can actually measure the impact of adding SDKs or improving configurations, seeing results reflected in incremental and clean builds. It’s been invaluable for decisions like upgrading hardware—we can point to real data showing how different machines affect build times. The metrics are broken down beautifully, no extra setup or build phase hacks required—it just works quietly in the background. Honestly, it’s something we could never have justified building in-house, but it’s been a total game-changer.”
5. Not peeking deeper into the build products
You can find another directory worth peeking deeper into at Derived Data → <Project Name> → Build → Products → Debug → <app_name>.app.
Most of the times, you can find this same file in Xcode’s files overview inside the Products folder.
This .app file is the compiled version of your application. While it’s better to use the release scheme configuration before peeking, you can even learn from the debug products.
Here’s how:
- Right-click the
.appfile and selectShow Package Contents - Navigate through the directories and look for unexpected files
There are a few common examples that you can run into:
- The
Resourcesdirectory could contain unused or unoptimized assets, leading to a larger app size outcome - The
Frameworksdirectory could show embedded frameworks that are no longer used - A 3rd party dependecy could have silently injected all kinds of resources via a
.bundlefile
Each of these could impact your app’s size, what could eventually impact business metrics like number of installations.
Conclusion
The Derived Data folder is an essential directory for iOS engineers. While we don’t work with it daily, it can be a source of productivity improvements. Whether it’s cleaning build data or monitoring metrics with RocketSim, you need to be aware of it.
If you like to improve your Xcode knowledge, even more, check out the Xcode category page. Feel free to contact me or tweet me on Twitter if you have any additional tips or feedback.
Thanks!