App Launch Time is the time it takes before your app becomes responsive after startup. As the first experience of your user it’s important that it’s smooth and as fast as possible. A slow startup time could mean losing a lot of users which can result in less usage in your app.
Even-though today’s devices are super fast, we still have to be conscious about keeping our launch time as short as possible. Without monitoring closely, you could end up adding delays that slow down startup time. The good news is that with a few best practices, you should be able to keep your app launch time performant enough.

1: Set a target launch duration
Before you start optimising anything it’s good to know where you are today. How is your app performing? Is there actually a slow startup time or are you fine with the current threshold?
After measuring it’s important to set a realistic target launch time for your app. At WWDC 2019, Apple recommends your app taking at most 400ms to render the first frame. This might be optimistic for your app but it should at least be your target.
2: Write a test to create consistent monitoring and prevent regressions
Nothing is more frustrating than putting a lot of effort in improving your app startup time and throwing it away easily. Even-though you might be up to date on best practices for launch times, your colleagues might be not.
By writing a test that runs often you’ll make sure to catch regressions and prevent your launch time from increasing without notice. Ideally, you would run this test on every pull request.
Using the XCTApplicationLaunchMetric inside a measure test makes it simple to write a test for launch performance. You can do this by adding the following test class to your UI testing target:
import XCTest

final class AppLaunchTimeTests: XCTestCase {

    /// Measure warm launch over 5 iterations (after one throw-away launch)
    func testLaunchPerformance() throws {
        // This measures how long it takes to launch your application.
        measure(metrics: [XCTApplicationLaunchMetric(waitUntilResponsive: true)]) {
            XCUIApplication().launch()
        }
    }
}
This UI test launches your app 6 times and only uses the last 5 measurements. The first launch is skipped as this is seen as a “cold launch” in which caching needs to be set up.
To fully understand this it’s important to point out the three different kind of launches:
- Cold launch — occur after reboot, or when your app has not been launched for a very long time.
- Warm launch — each launch after a cold launch took place. Your app still needs to be spawned, but your app is already brought into memory and system-side services are already started.
- Resume launch — Reopening your app from either the home screen or app switcher. This is going to be a fast launch as your app is already running
To create consistent measurements you would ideally test in the following circumstances:
- Always measure warm launches
- Test on a real device, reboot it, and let the system quiesce for 2-3 minutes
- Use unchanging or no iCloud account on this device. This could lead to a lot of work happening in the background, slowing down your app startup time
- Use a release build of your app to reduce the overhead debugging tools and take advantage of compile-time optimisations
- Enable Airplane mode or mock the network to create consistent performance for networking calls happening during launch
Obviously, these are not realistic for automated testing. However, combining an automated test with manual testing should bring you in the right place to create consistent measures over 5 launches.
3: Use Xcode’s organizer for app launch time performance statistics
Xcode’s organizer metrics tab brings us a lot of insights from our real users. Besides battery and memory statistics we can also gain insights in app launch performance across app versions. This is a great way to see whether your improvements resulted in better performance after a release.
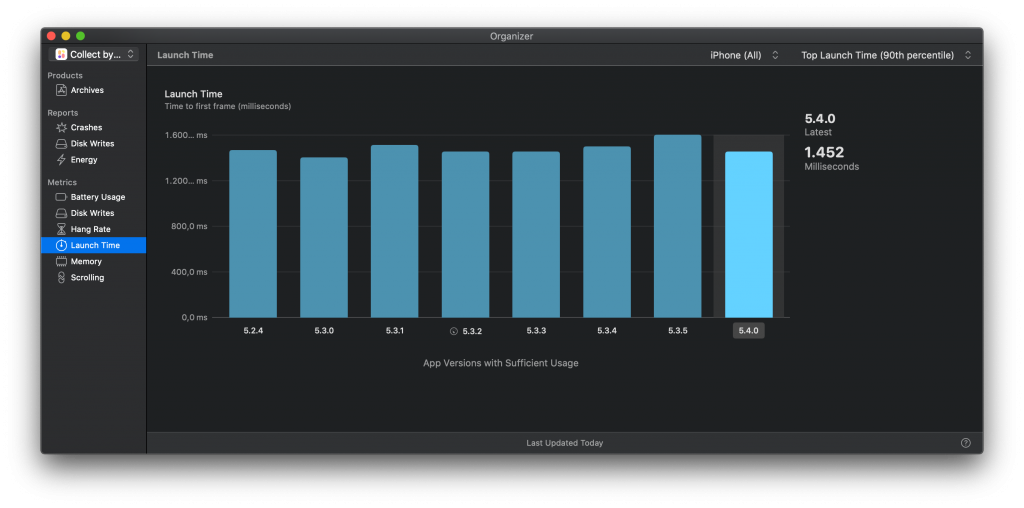
Ideally, you would have the same results per app version and per operating system. Apple improves app launch performance in major updates like they did with iOS 13 by introducing caching for custom dynamic libraries. These statistics in Xcode’s organizer don’t filter on operating system which could mean that your slowest launch times are a result of devices running an older operating system.
Tools like Firebase allow you to gain those insights per operating system but it does mean adding another dependency which could result in slower launch times. Instead, you can decide to filter on a specific newer device which guarantees iOS 13 or up. By using that same device for each time you measure you will still keep a consistent source of input. However, these are newer device with better performance, likely resulting in better launch times. Therefore, choose carefully how you want to use this data in Xcode’s organizer.
4: Manage frameworks using DYLD statistics
DYLD is the dynamic linker that loads and links shared libraries for your app when it’s executed. When your app has a lot of dependencies added as dynamic libraries this process could easily slow down your startup time.
To gain insights in this phase of your app’s launch we can use the DYLD_PRINT_STATISTICS environment variable by setting it to 1:
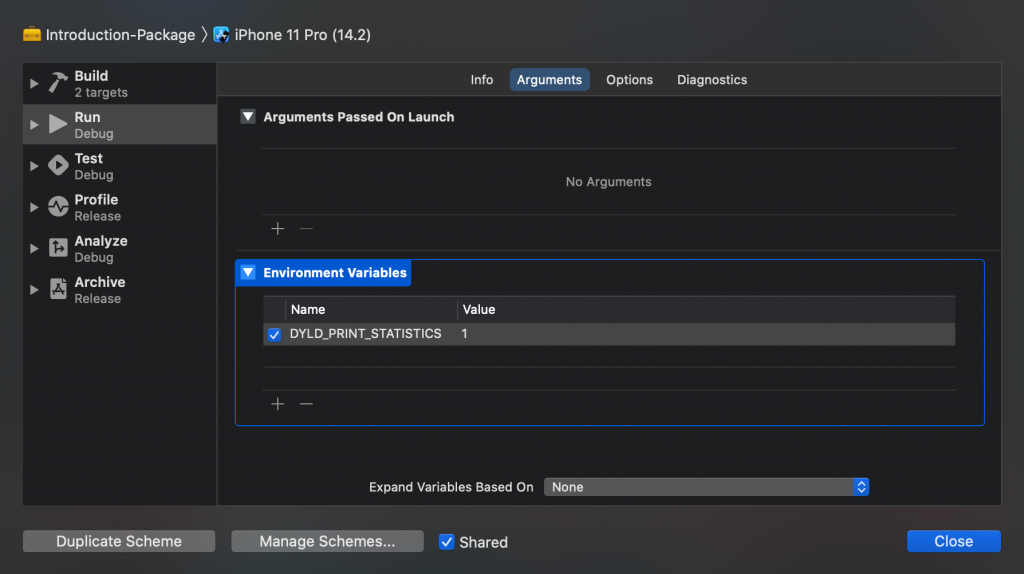
Running your app using this environment variable will result in the following statistics being printed out in the console:
Total pre-main time: 1.4 seconds (100.0%)
         dylib loading time: 632.54 milliseconds (44.0%)
        rebase/binding time: 132.96 milliseconds (9.2%)
            ObjC setup time: 245.92 milliseconds (17.1%)
           initializer time: 425.90 milliseconds (29.6%)
           slowest intializers :
             libSystem.B.dylib :  18.32 milliseconds (1.2%)
    libMainThreadChecker.dylib :  51.72 milliseconds (3.5%)
                         Okapi : 354.62 milliseconds (24.6%)
                 ContentViewer :  56.55 milliseconds (3.9%)
These are example statistics from the Collect by WeTransfer I’m developing at my day to day job. We’ve been investigating our launch times as well and used these statistics to improve. Both Okapi and ContentViewer are frameworks of our own which according to the statistics have a great impact on launch performance.
In our case, we had the possibility to change the frameworks from a dynamic to a static library. We did this by loading them through Swift Package Manager instead of GIT submodules and explicitly setting the frameworks type to static:
products: [
    // Products define the executables and libraries a package produces, and make them visible to other packages.
    .library(
        name: "Okapi",
        type: .static, // Explicitly mark as static.
        targets: ["Okapi"]),
]
It might not always be possible to do this for 3rd party dependencies but every framework that is in your control can help reduce launch times by changing it to a static library. Static libraries are included at compile time while dynamic libraries are loaded at runtime.
Even-though iOS 13 introduced caching for custom dynamic frameworks, we still gained performance wins by loading our dependencies as static libraries.
5: Replace or remove dependencies where possible
We’ve just read how you can optimise dependency by loading them as static libraries. However, the best way to gain performance wins is by either replacing or removing dependencies.
Some frameworks can be replaced by system libraries which will result in better app launch performance. An example could be replacing RxSwift with Combine or any crypto framework with SwiftCrypto. This might require to change your minimum deployment target to iOS 13 or above but if that’s not an issue this is a great way to gain better startup times.
Removing a 3rd party dependency could also be an option. It could be that the code is no longer used or it might be that you’re only using a small portion of the framework which you could relatively easy rewrite on your own. This is a case per case situation in which you should decide for your own project what is best to do.
6: Defer logic until the first frame is rendered
Using the App Launch Time template in Xcode’s instruments you can gain insights in how your own code is affecting the startup time.
The template itself gives us insight in the app’s life cycle during startup.
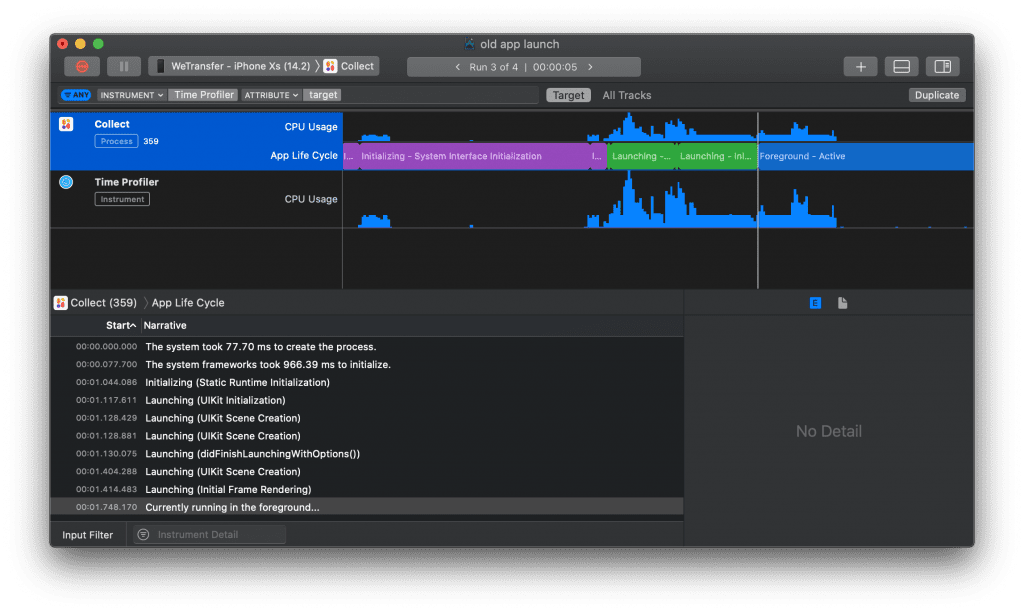
This is a great way to gain early insights in which phases are causing the most delays.
Instruments are especially great for zooming into your own code which is causing performance drains.
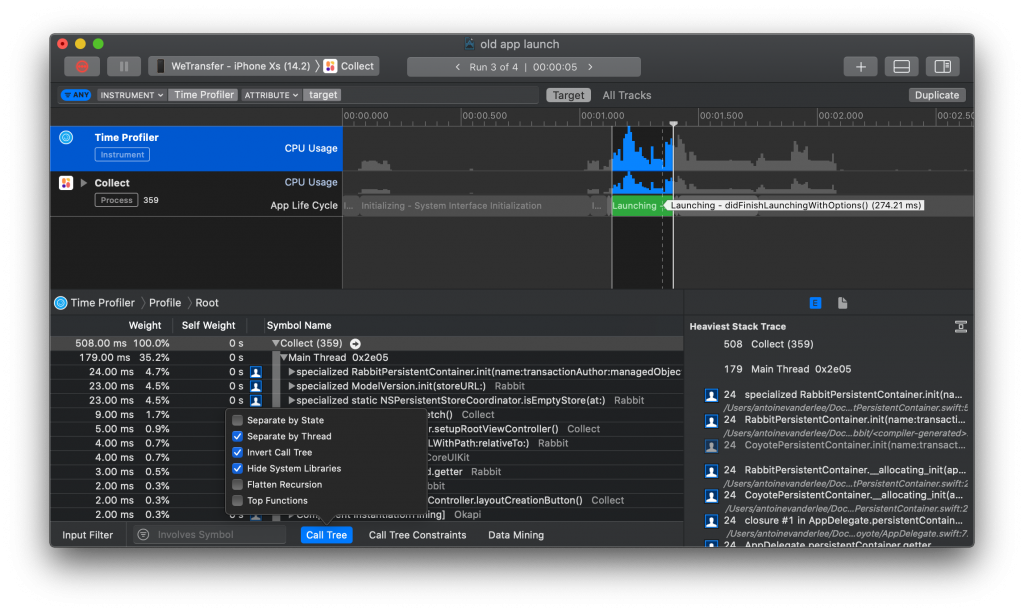
You can see that I’ve selected the green range which is representing the didFinishLaunchingWithOptions method. In the case you’re using a scene delegate you’ll find other methods here but it’s at least the green phase you want to zoom into. Using the Call Tree filters to separate by thread, inverting the call tree, and hiding the system libraries we make it easier to point out our own code that’s causing delays.
In our case, we gained performance wins by only loading the data that was necessary for rendering the first frame. You can do this by setting a limit to the number of items requested in any of your network calls (if possible). Also, certain refresh methods might not be required to execute directly at launch. Defer those until after your app has been launched successfully.
When profiling using this template it’s important to use the release scheme and following the instructions given in tip 2 of this post. However, once you start digging into the code that’s causing slow performance you want to use the debug scheme to symbolicate symbols. Otherwise, it’s impossible to know which methods are actually causing slow performance.
7: Optimise the performance of app launch-related logic
It’s not always possible to defer logic. Instead, you might want to look into crucial methods and see how you can improve those. You’ll keep your startup logic the same but you’ll optimise the way it’s running or calculated.
There are many ways of doing this but it all start by diving into instruments and point out which methods can gain improvements.
We optimized our app by setting a batch size on the fetch requests to lower the number of Core Data entities loaded for our first screens which gave a better fetching performance. You should identify your slowest methods and see how you can improve those for better results.
Conclusion
App Launch Performance is influenced by many factors. It all starts with measurements and setting a target startup duration. Xcode Instruments and DYLD statistics gives us the right direction to start improving our app’s startup time.
If you like to prepare and optimize, even more, check out the optimization category page. Feel free to contact me or tweet to me on Twitter if you have any additional tips or feedback.
Thanks!