Xcode Instruments is a developer tool that comes for free with Xcode. It has a lot of useful tools to inspect and improve your app. Although it has a lot to offer, it’s often an area which is a bit less known.
In this blog post, I’ll show you how I’ve improved the performance in a crucial part of the Collect by WeTransfer app by using Xcode Instruments. To give you an idea of the results, this is the before and after outcome in which the part after “Importing photos” has been drastically improved:

As you can see, the importing popup shows way longer in the old version while the final share sheet is being delayed a lot as well.
The better this part in your app is, the better your app is performing.
Time to dive in and see how we improved this flow!
What is Xcode Instruments?
Xcode Instruments is best described as a powerful and flexible performance-analysis and testing tool. It’s part of the Xcode toolset which also includes tools like Create ML and the Accessibility Inspector.
The instruments can be used to:
- Track down problems in your source code
- Analyze the performance of your app
- Find memory problems
And a lot more!
How can I access Xcode Instruments?
You can access the instruments by using Product ➔ Profile from the Xcode menu for which the shortcut handle is ⌘ + I. This will rebuild your product and opens the Xcode Instruments overview.
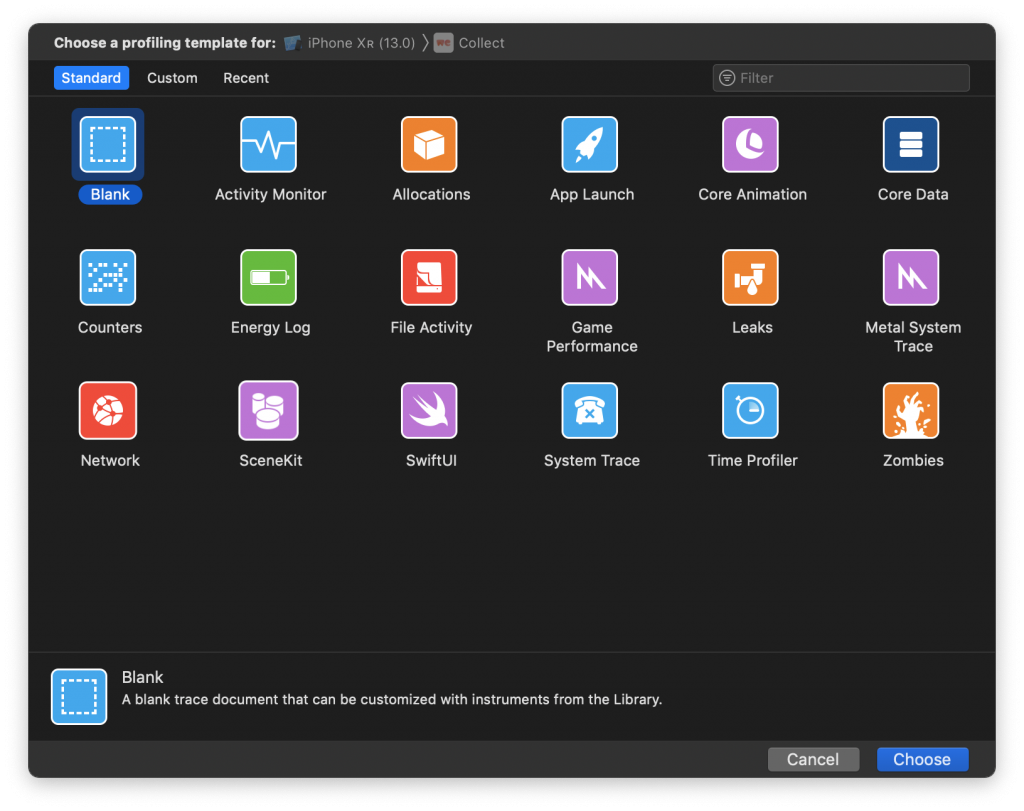
Should I know how to use each instrument?
An overview which shows 17 different instruments can be quite overwhelming. Each of them can be very valuable but they’re definitely not needed for every app. Some of them, like the Game Performance instrument, is only valuable if you’re developing games.
It is worth though to dive into the available instruments and to know which ones are available. You might end up in an issue which can be perfectly solved by one of the available instruments.
Can I use instruments in the simulator?
Although most of the instruments can be run on the simulator it’s not always recommended to do so. A physical device will show more realistic results and is therefore recommended to be used.
FREE 5-Day Email Course: The Swift Concurrency Playbook
A FREE 5-day email course revealing the 5 biggest mistakes iOS developers make with with async/await that lead to App Store rejections And migration projects taking months instead of days (even if you've been writing Swift for years)
Using the Xcode Instruments Time Profile to investigate and improve the performance
The Time Profiler instrument gives insights into the system’s CPUs and how effective multiple cores and threads are used. The better this part in your app is, the better your app is performing.
In the Collect app performance example, we had the goal to speed up the flow of adding content to our app. The Time Profiler is our starting point to get insights in which part of the code can be optimized.
Creating a new recording using the Time Profiler instrument
After selecting the Time Profiler Instrument we can start a new recording by pressing the red button on the top left or by using ⌘ + R. This will launch your app in the selected device after which you can start your flow.
After you’ve finished the flow you want to improve you can stop recording and dive into the results. We first want to know how the main thread is used. The UI is blocked when there’s a lot of work happening on the main thread which is exactly the problem we’re experiencing in our Collect app.
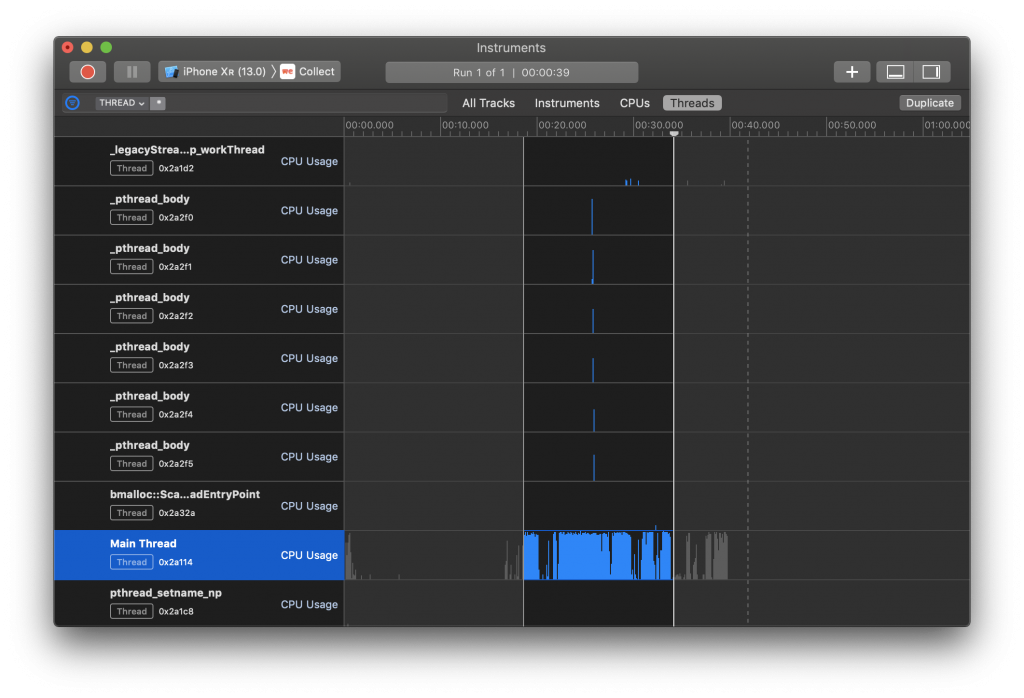
Using filters to create an overview of threads
The filter bar can be used to narrow down the overview and get a better insight into the used threads by selecting the Threads tab. Scrolling down shows that our main thread is heavily used while the other threads are not so busy:
Identifying which part of the code can be optimized
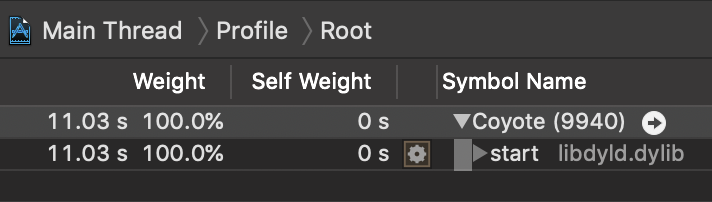
Using ⌘ + D will open up the Detail area if it’s not yet visible. This shows the symbol names for the highlighted period. In the previous example, you can see that the peaks in the graph are highlighted in blue. You can do the same by using click and drag on the part you want to investigate.
At first, it looks quite unusable looking at the symbol names in the detail area:
Although the right side of the detail area shows us the Heaviest Stack Trace, we can use the Call Tree input filter to get an even better overview. This will also improve the heaviest stack trace view by hiding certain symbols.
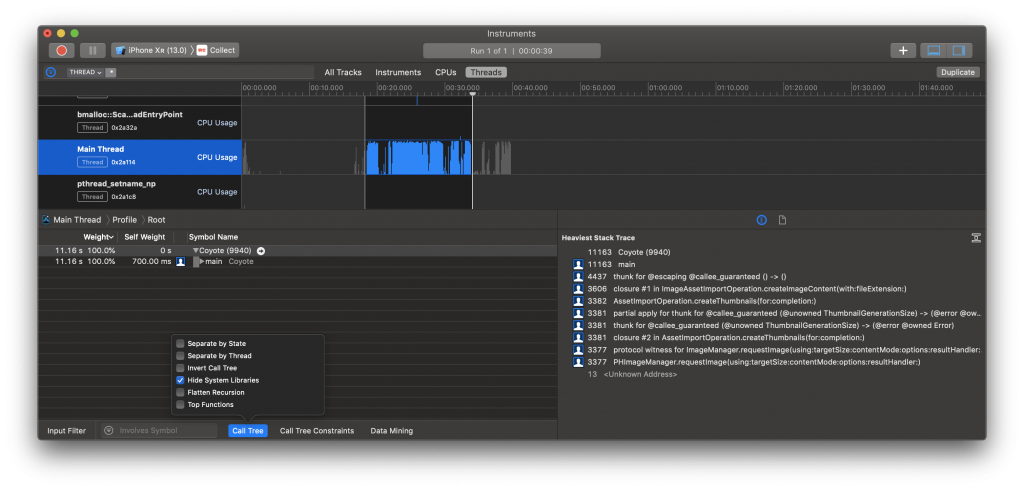
We start with Hide system libraries which will take away all lower-level symbols which are not in our control and can’t be optimized by us either way. As you can see, the Heaviest Stack Trace overview is a lot cleaner now already.
Next up is the Invert Call Tree filter will make the top-level methods visible without having to click through each call tree. In combination with sorting on the Weight column, we can see exactly which methods should be optimized.
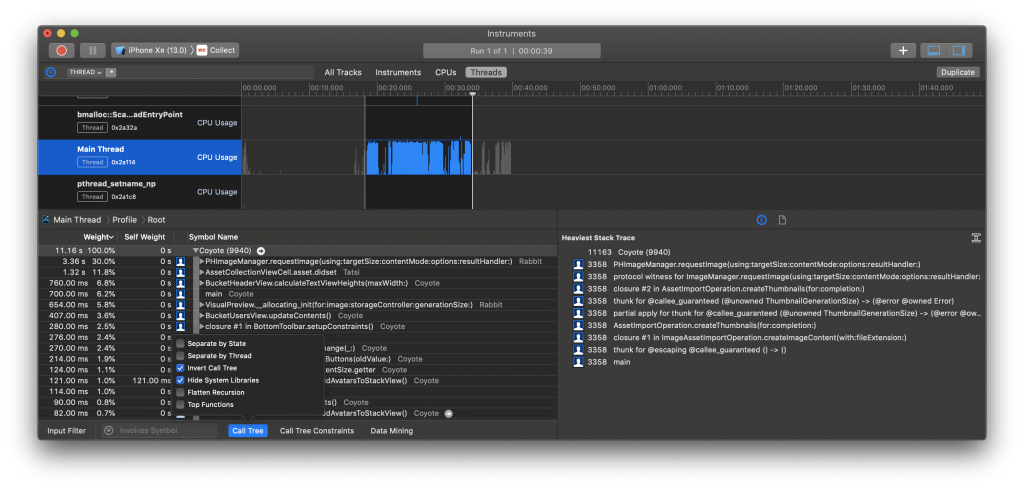
It’s pretty clear that our PHImageManager code is performing the worst as it takes 3.36 seconds from the total 11.16 seconds. It turned out that we could move this to a background thread quite easily and offload the main thread for this part.
Another thing we noticed is the BucketHeaderView which is recalculating its height all the time although we didn’t do anything with it in the flow we’re testing. It turned out that we indeed didn’t have to do this.
Validating the results
After you’ve improved your code it’s time to re-run the Time Profiler and validate the results to make sure it has actually been improved.
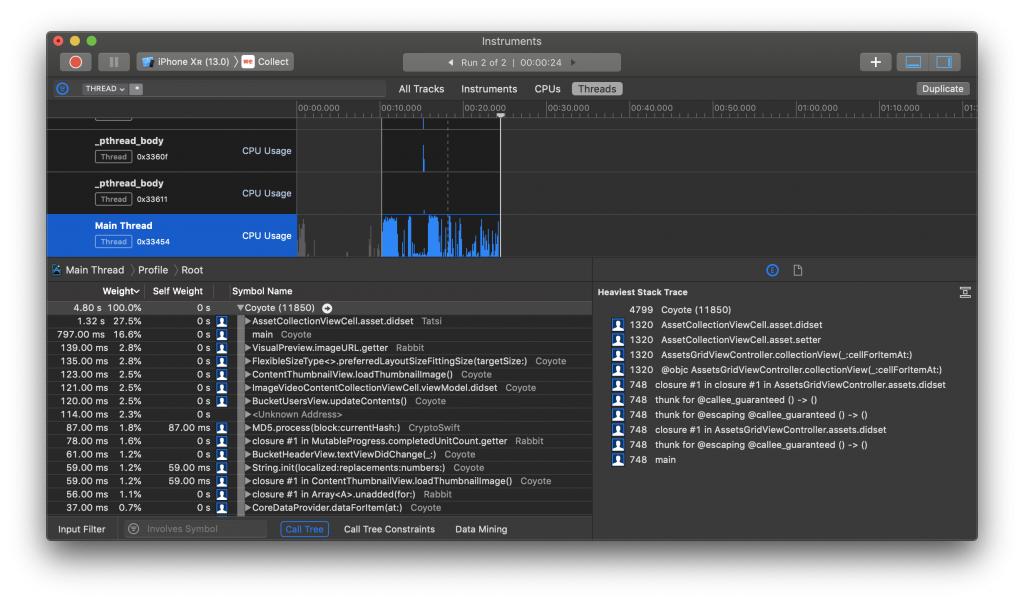
Although we’ve seen the improvements ourselves already in the before and after video shared earlier, we can now also see that the same flow no longer contains the PHImageManager as the heaviest stack trace. This is confirming that our code change has worked.
The header is also no longer recalculated and the performance of our flow has been improved.
Conclusion
Xcode Instruments contain a lot of valuable tools to improve the performance of your app. The Time Profiler can be used to dive into a certain flow, improve a piece of code, and validate right after.
Take some time to dive into the available instruments so you know which are useful when and start improving your app. If you’re into improving, even more, you might want to read my blog post on improving your build performance as well!