Build performance can be analyzed in Xcode to speed up your builds. This can quickly speed up your workflow and save a lot of time during the day for all developers working on the project. Slow builds often distract us as they enable us to focus on distractions like social media and Slack.
By investigating your build performance and investing some time to improve where possible, you’ll see that you can make progress with a few small steps. I’ve made RocketSim’s incremental build time 4x faster using several optimizations. Let’s dive into the options we have today.

In case you’re looking for automatic ways to improve your build times: Xcode Build Optimization using 6 Agent Skills
“… so I saved 6.3 seconds with each incremental build!”
Measuring build performance using the Xcode Build Timeline
Before we start diving into optimizations, it’s essential to measure your project’s baseline. You can continuously compare the baseline as you implement improvements.
Start by running a clean build using CMD ⌘ + SHIFT ⇧ + K or selecting Product ➔ Clean Build Folder... from the menu. The build folder contains cached build files that speed up incremental builds but create an incorrect baseline for performance optimizations. It’s essential to compare builds using the same environment you’ll make by cleaning your build folder.
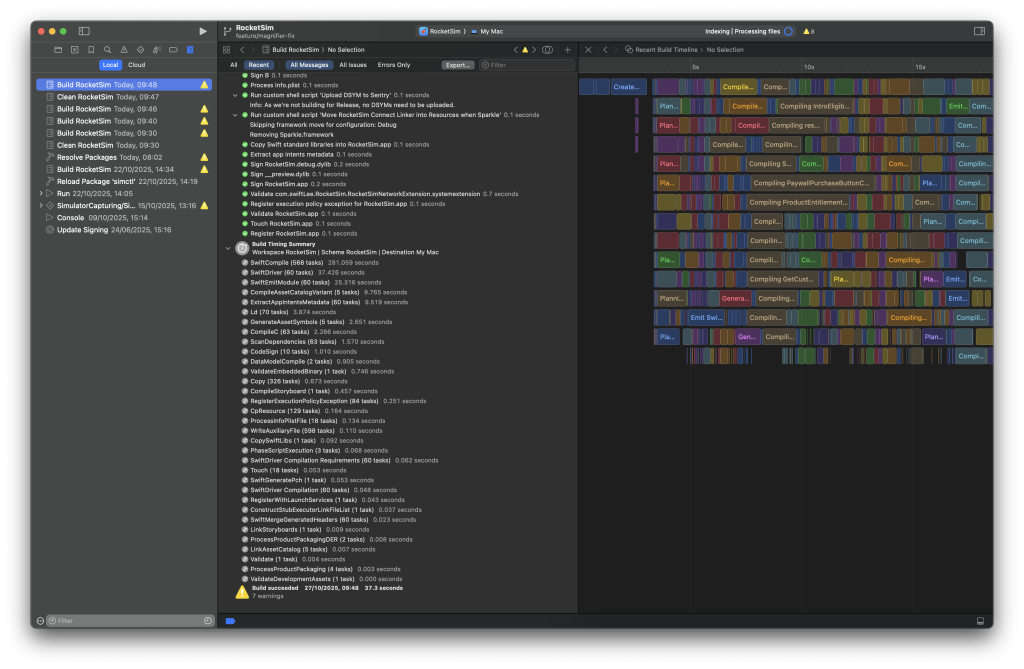
You can start a fresh build after Xcode completes the cleanup using CMD ⌘ + B. Select your build inside the Report Navigator once the build completes, and make sure to open the assistant to show the Build Timeline:
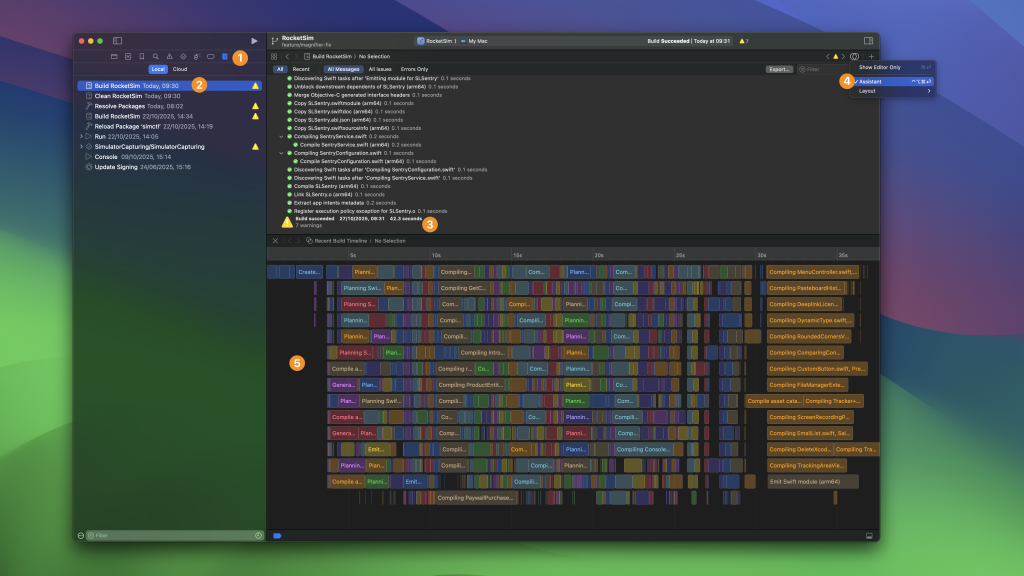
The above image demonstrate the exact steps to follow:
- Open the build navigator
- Select your latest clean build
- Make a note of the current build duration, this is your baseline
- Open the assistant
- Start diving deeper into your build statistics
The assistant shows you where all the time is spent during the clean build. In the above example, you’re looking at the optimized version of the RocketSim project with optimized parallelization. The latter means that my MacBook’s cores are used optimally, since every row is constantly filled with build processes. I encourage you to watch the WWDC 2022 session Demystify parallelization in Xcode builds to learn more about this concept.
We will use this Build Timeline as our starting point for investigating build performance. You can find potential improvements by zooming into specific blocks that execute serially.
Analyzing incremental builds
I decided to run another build, which will become an incremental build. After looking into the assistant, we can see that it’s way less busy. This is because it’s building incrementally. Yet, there’s a lot of time spent on a single piece:
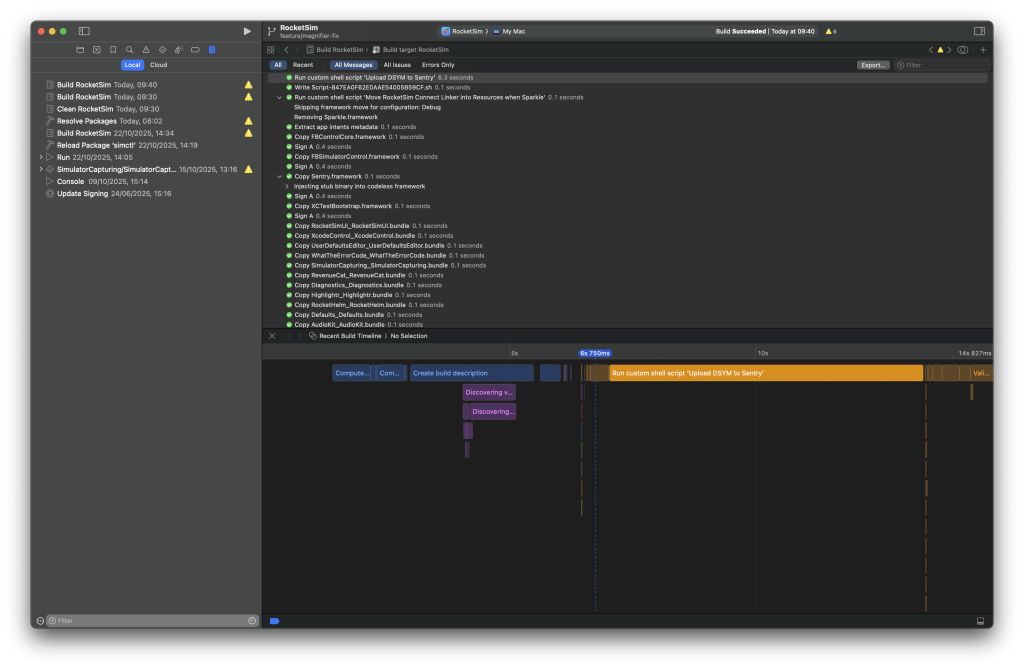
After clicking the specific build block, you can find more information about the process that was executed. In my case, I found out that all my debug builds were uploading DSYMs to Sentry. Of course, that’s not needed for every debug build, so I saved 6.3 seconds with each incremental build!
In this case, I did this by adding an if statement around the build phase script to only run for release builds:
if [ "${CONFIGURATION}" == "Release" ]; then
    # ... Build script logic
else
    echo "Skipping build script for non-release builds."
fi
FREE 5-Day Email Course: The Swift Concurrency Playbook
A FREE 5-day email course revealing the 5 biggest mistakes iOS developers make with with async/await that lead to App Store rejections And migration projects taking months instead of days (even if you've been writing Swift for years)
Build performance insights with Build Timing Summary
The Build Timing Summary is another baseline insight you can use during build performance optimizations. It builds your project once and summarizes the time spent per category.
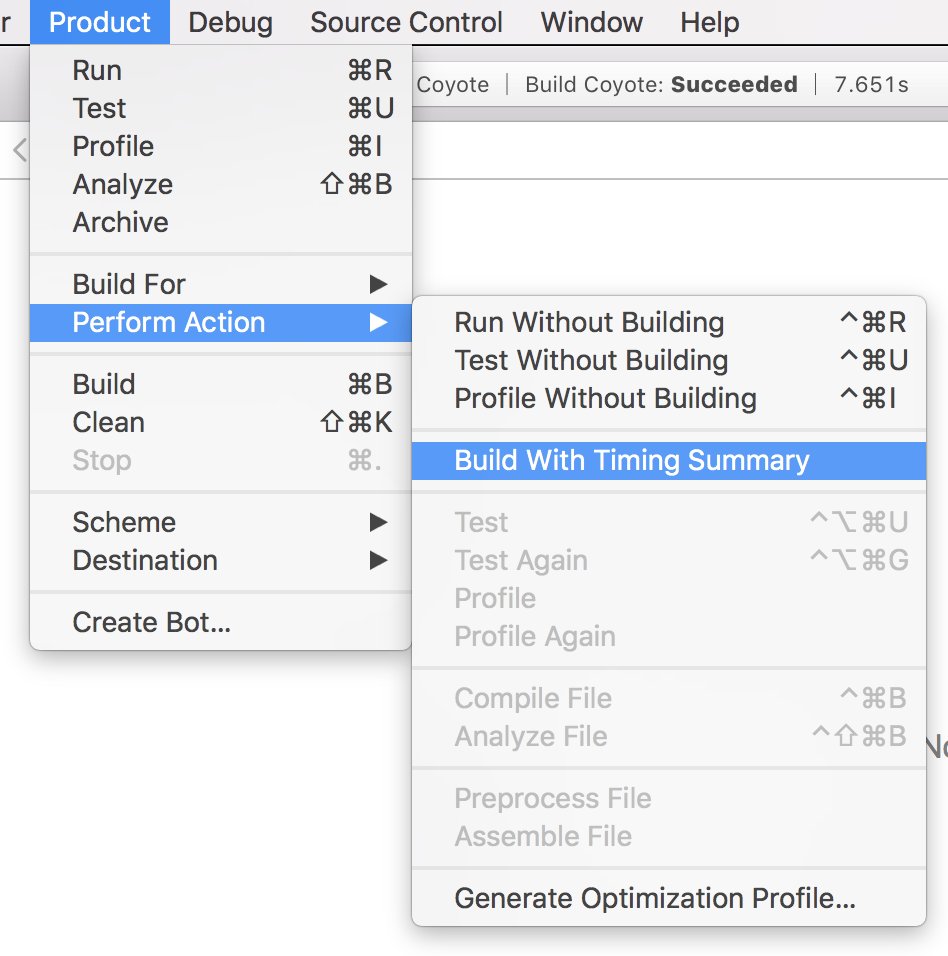
The action can be triggered in the product menu using Product ➔ Perform Action ➔ Build with Timing Summary or using xcodebuild -showBuildTimingSummary.
After executing this action, you’ll see that Xcode starts building your project on the selected target device or simulator.
After the build finishes, navigate to the Report Navigator and select the last build. Select “Recent” and scroll all the way down until you see the Build Timing Summary. Here’s the result for RocketSim’s project with a clean build:
I love this overview as a starting point whenever I dedicate time to build optimization. I have the build timing summary on the left, and a more detailed overview on the right. In most cases, most time will be spent on compiling Swift files, for which you should focus on parallelization optimizations. Also, I recommend you look at the run script execution times to see if there’s room for improvement.
Note that I did a clean build here, which differs from an incremental build. It’s worth executing the action again to obtain a different Build Timing Summary. You’ll run incremental builds most of the time, so it’s worth finding slow parts that influence both clean and incremental builds.
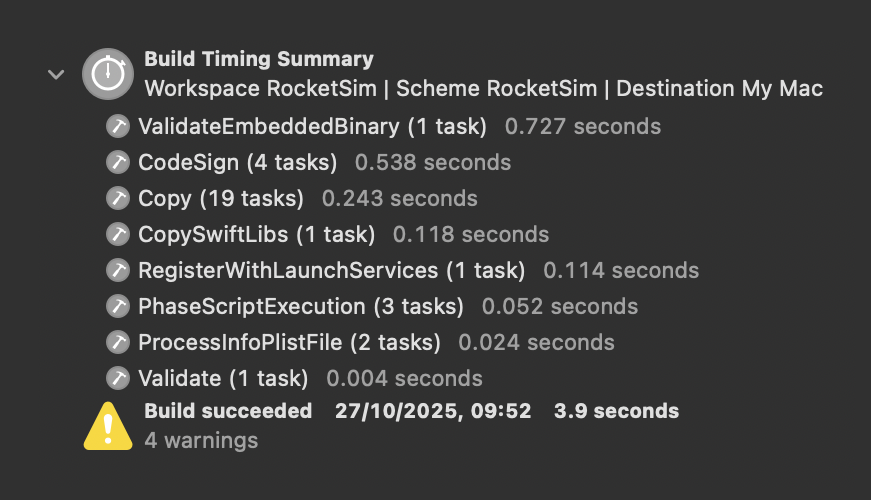
The above example represents an incremental build after completing optimizations for the RocketSim project. We’re nearly running any scripts and have completed the build in an acceptable 3.9 seconds.
How can the duration of Compiling Swift Sources be longer than the total build time?
Before we dive into optimizations, I want to point out that compiling the Swift sources takes longer than the total build time. The above clean build took 37.3 seconds to succeed, while compiling the Swift sources took 281 seconds.
I’ve asked Rick Ballard from the Xcode Build System team for clarification, and he gave some great insights into how the system works:
Yes – many commands, especially compilation, are able to run in parallel with each other, so multicore machines will finish the build much faster than the time it took to run each of the commands.
Optimizing build phases
Optimizing build phases is a great way to speed up Xcode builds. Some of our run scripts might not be required for debug builds and should only be configured to run for release builds.
In the past, I’ve been trying to improve the build times of the WeTransfer app. I found out that most of our time was spent on executing SwiftLint. For our main target, it took 10 seconds to execute for every incremental build.
One small improvement we found was adding the --quiet parameter, but we only gained less than a second per build. All bits helped, so we decided to keep this in. Our real significant improvement was filtering out files that weren’t changed. As we run SwiftLint in many of our submodules, we easily gained ~15 seconds of improvement per build, including all targets.
Only run a build phase if needed
If you have a build script you want to run only for debugging or release builds, you can include the configuration check:
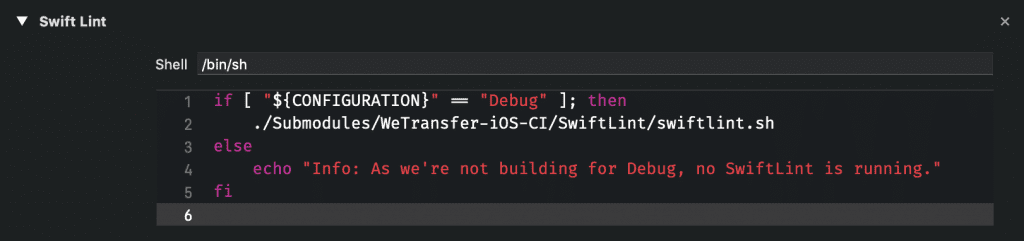
In this case, we’re only running the SwiftLint script for debug builds. You can obviously do the same by checking for “Release” builds if you want to run a script only for release builds.
Type checking of functions and expressions
To narrow down the causes of slow build times you can enable swift-flags to gather more insights. These flags were already available before Xcode 10, but are still very useful.
The compiler can warn about individual expressions that take a long time to type check using two frontend flags:
-Xfrontend -warn-long-function-bodies=<limit>-Xfrontend -warn-long-expression-type-checking=<limit>
The <limit> value can be replaced for the number of milliseconds that an expression must take to type check in order for the warning to be emitted.
To enable these warnings, go the Build Settings ➔ Swift Compiler - Custom Flags ➔ Other Swift Flags:
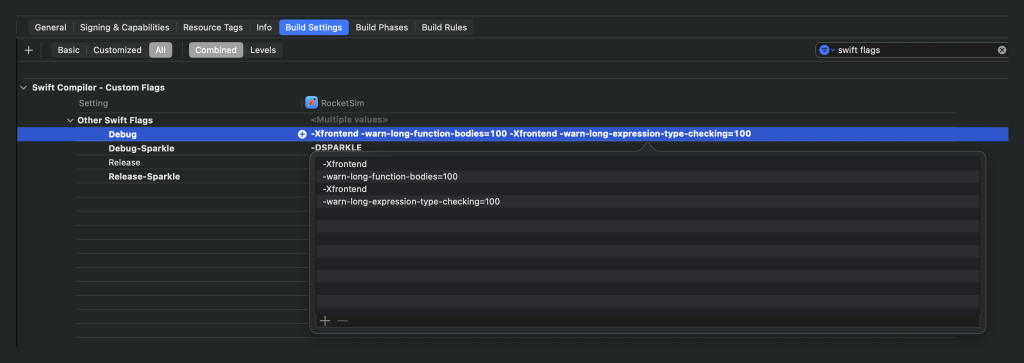
With this setting, Xcode will trigger a warning for any function that took longer than 100ms to type-check. This can point you to methods that are slowing down build times. Splitting those methods and adding explicit types might improve build performance.
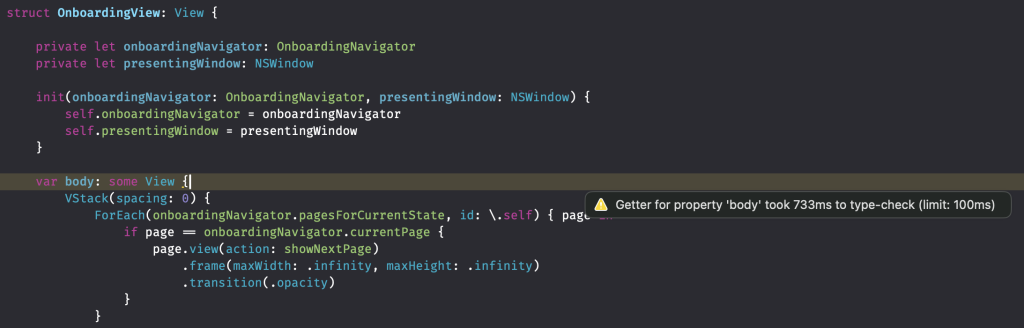
The above method results in a slow type-check, which is bad for build performance. In this case, I’ve had a long SwiftUI view that I could break down into smaller ones by following the principles explained in SwiftUI Architecture: Structure Views for Reusability and Clarity.
Build settings to speed up build performance
Speeding up Xcode builds by altering a few Xcode build settings used to be a common technique to quickly gain seconds on an incremental build. Nowadays, Xcode has most of these settings set by default, so there’s little to cover. However, it could be that you’re maintaining an old project where these settings still need to be set or are being overwritten with the wrong values. Therefore, here is a short overview of the recommended settings of today.
Compilation mode
- Debug: Incremental
- Release: Whole Module
Optimization Level
- Debug: No Optimization [-O0]
- Release: Fastest, Smallest [-Os]
Build Active Architecture Only
- Debug: Yes
- Release: No
Debug Information Format (DWARF)
- Debug – Any iOS Simulator SDK: DWARF
- Release – Any iOS SDK : DWARF with DSYM File
Enabling Eager Linking
You can enable eager linking for your project to see if it results in better build times. If enabled, the build system will emit a so-called TBD file for Swift-only framework and dynamic library targets to unblock the linking of dependent targets before their dependency has finished linking. You can learn more about linking by watching WWDC 2022 session Link fast: Improve build and launch times.
Run Build Script Phases in Parallel
Running build script phases in parallel can potentially lead to improved build times. I recommend combining it with User Script Sandboxing to disallow undeclared input/output dependencies. Only scripts with specified inputs and outputs and those configured to run based on dependency analysis will be attempted to run in parallel.
Swift Package Build Plugins
Swift Package Build Plugins significantly influence build times. In the WeTransfer app, I discovered that a prebuilt plugin causes build-cache invalidation and increases incremental build times. We had the opportunity to switch to a regular build plugin, which reduced cache invalidations and sped up incremental builds.
It’s also important to know that a package build plugin always takes time to run:
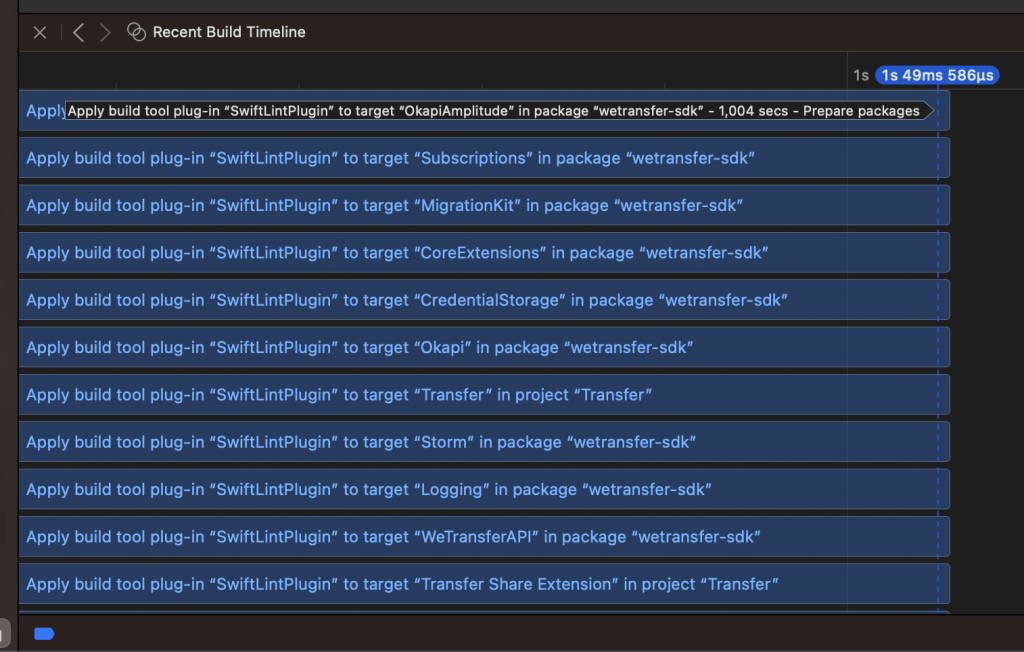
In the above example, there were no files to lint, and the build plugin returned no build commands. I would’ve expected close to zero impact on overall build times, but there’s still some work to be done. Note that these timings can improve with Xcode versions; my main point here is to raise awareness.
Monitoring build times automatically
You’re probably reading this article after discovering that your builds are slower. Ideally, you would be notified automatically when a build becomes slower, so you can exactly pin point the cause. For example, I would’ve been notified about the new build script phase that I added, as it suddenly added 6 seconds per build.
To put things into perspective:
- 6 seconds slower builds
- 100 builds per day
- 10 developers
That’s 6 * 100 * 10 = 6.000 seconds, aka 1 hour and 40 minutes extra spent waiting on builds to complete per day. This is exactly why 200+ teams started using RocketSim for Teams.
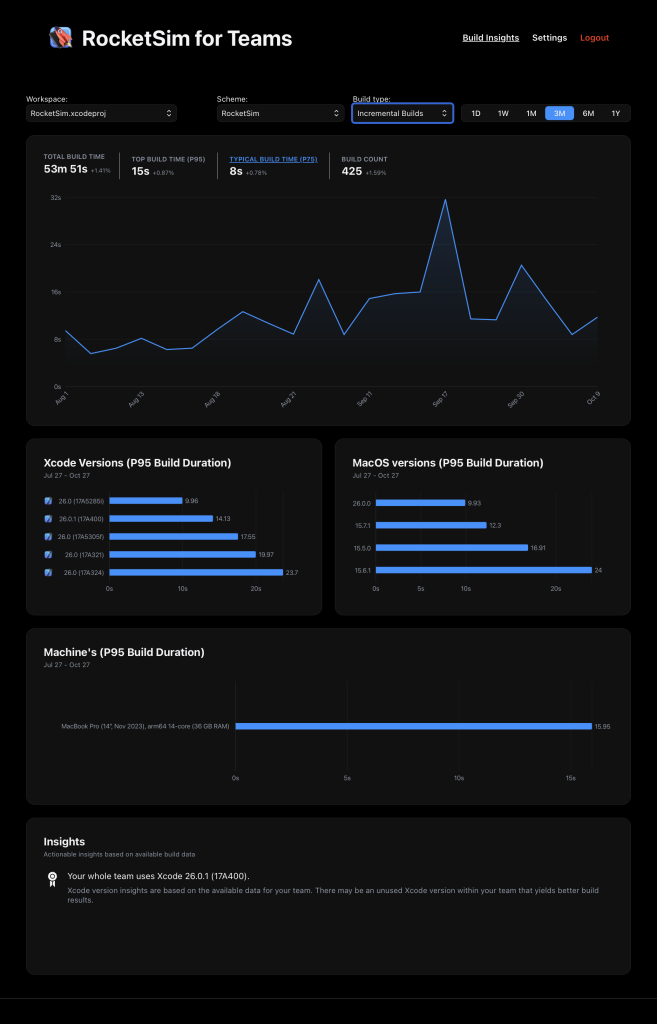
Within RocketSim’s team dashboard, you can explore the build duration performance for your whole team. You can answer questions like:
- Which machine performs best? Or: should we move the whole team to the latest MacBook?
- How does the macOS or Xcode version impact build performance?
- Are our build times improving?
Especially the latter is important, as it provides you the insights you need to decide to revisit build performance or not.
You can start a free 14-day trial with your whole team to try it out.
Conclusion
Now and then, it’s good to revisit your Xcode build times. You can benefit from every second you gain, and remember that it builds up over time: a second for every build is a minute for every 60 builds you do. Improvements can be made throughout project settings, build phases, and code-type checking improvements.
If you like to prepare and optimize yourself, even more, check out the optimization category page. Feel free to contact me or tweet to me on Twitter if you have any additional tips or feedback.
Thanks!