The Xcode Debug Console allows you, as a developer, to explore logs and debug issues with your apps. All your logs will be printed out, and you can interact with the LLDB debugger as soon as your app pauses manually or due to a breakpoint.
Xcode 15 introduced a new version of the debug console with an enhanced logging experience. Each log level will be printed with a different color, and advanced filters allow you to narrow down the logs you’re only interested in. Before continuing, I’d like you to read my article OSLog and Unified Logging, to ensure your logs work great with the new console.

A look at the Xcode Debug Console
You’ll find the Xcode Debug Console at the bottom of your view. If it’s not visible, you can tap CMD ⌘ + SHIFT ⇧ + Y or access the same option via the menu View → Debug Area → Show Debug Area.
The debug console looks as follows:
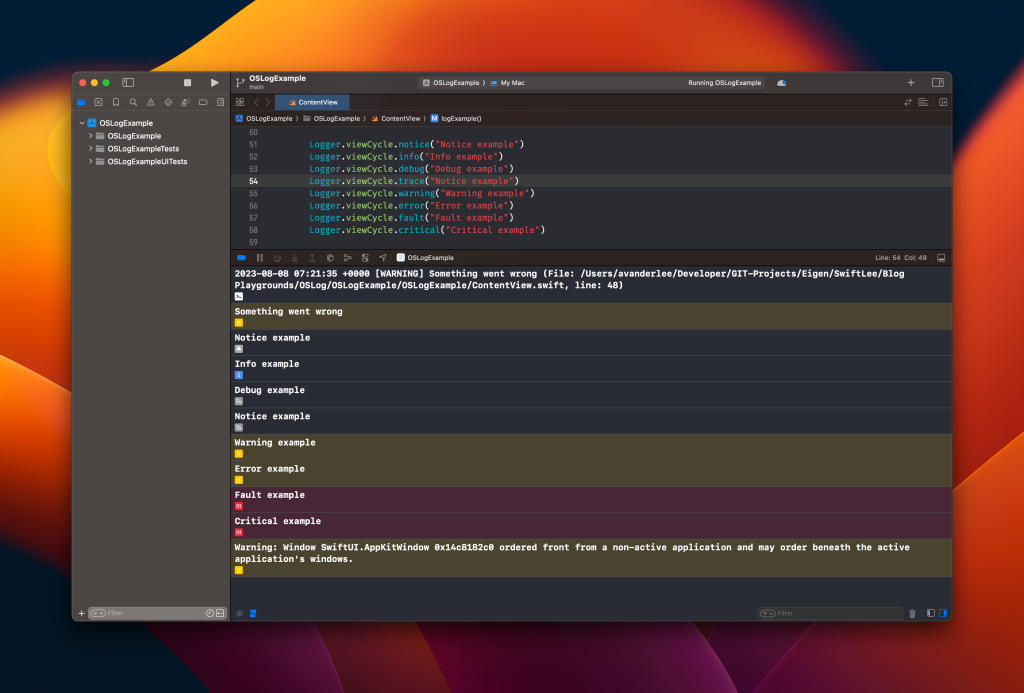
In this case, it’s the bottom right section of Xcode’s window. As you can see, the console displays all my logs in consecutive order. Depending on the log level used, a different background color will highlight the line of text. I did not enable enhanced filtering or metadata options for this example. Let’s dive into the possibilities that come with the latest version of Xcode’s debug console.

FREE 5-Day Email Course: The Swift Concurrency Playbook
A FREE 5-day email course revealing the 5 biggest mistakes iOS developers make with with async/await that lead to App Store rejections And migration projects taking months instead of days (even if you've been writing Swift for years)
Exploring metadata view options
You’ll find a button at the bottom left of the console to enable and disable metadata for all logs:
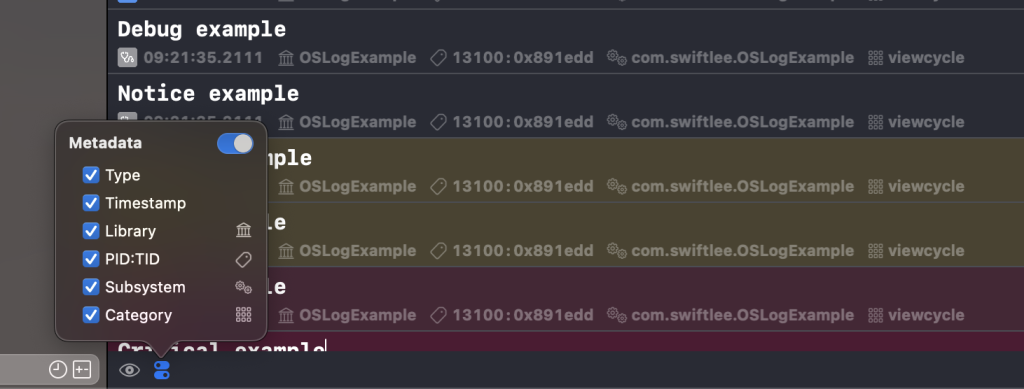
Each metadata option has a different meaning:
- Type: Shows the little square icon in front of the log to represent the log type. For example, it will show a red square for an error log.
- Timestamp: The time of when the log was printed
- Library: The source library from which the log was printed
- PID:TID: The process and thread identifier
- Subsystem: The configured subsystem for the used logger
- Category: The category you’ve used for the log
Depending on your preference, you can turn on and off metadata options to create an overview of the metadata you like. I prefer to enable type, timestamp, library, and category to help identify logs quickly.
Filtering logs
Inside the console, you can apply filters to narrow the list of logs based on your interests. For example, only showing warnings and errors:
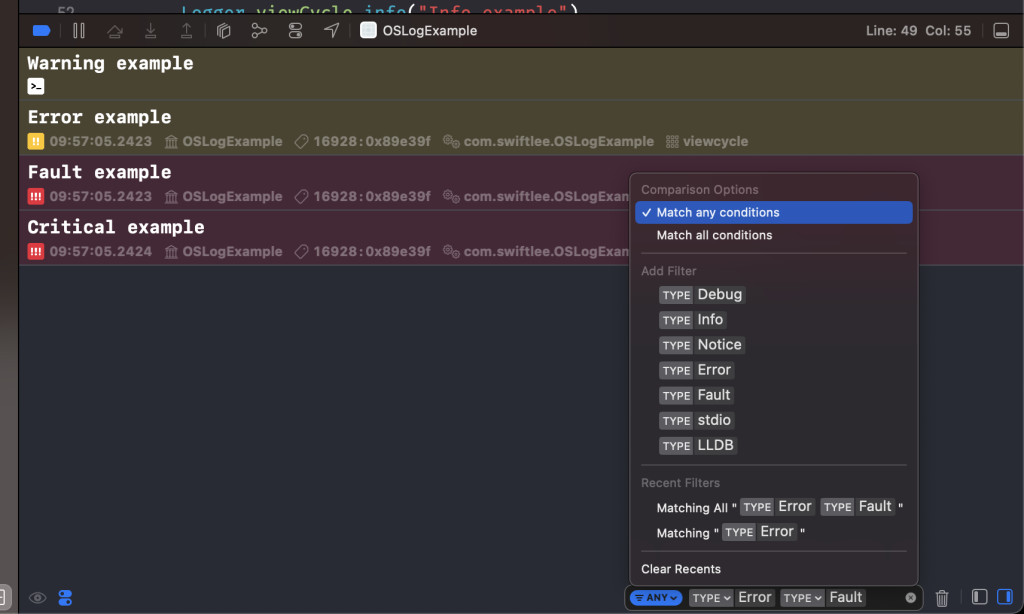
Notice that I’ve selected “Match any conditions” to ensure both error and fault logs will appear.
You can type any text inside the filter bar to only shows logs containing a given string. It allows you to create an overview that works for your current debugging session.
Navigating to the source code
A great addition to the debug console is the option to navigate to the source code for a specific log:
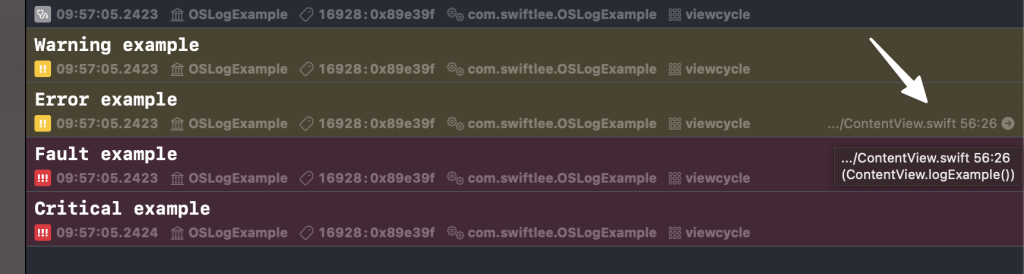
You can use this option to identify the source of a specific error or warning. Unfortunately, this option only works if you directly call Logger instances from your source code. If you’re using a logging facade, you won’t be able to forward the #file and #line as of today.
Using quicklook
A lesser-known feature of the Xcode Debug Console is the ability to use quick look on a log line:
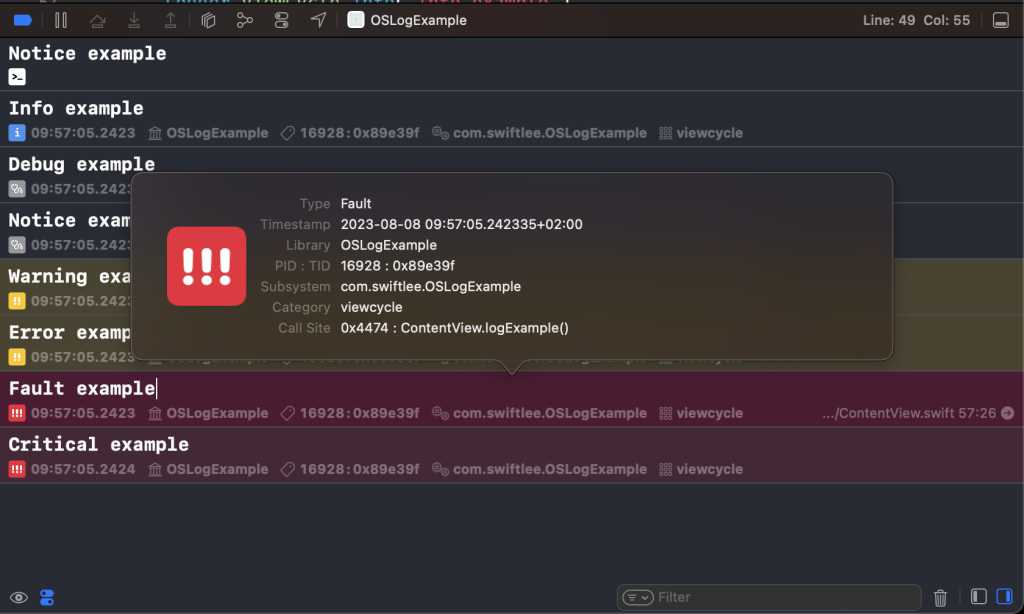
The quick look popup will show all metadata, even if you turned off all metadata in the console itself. It also shows the call site, which will indicate which method triggered the log. In this case, it has been the logExample() method inside my ContentView.
Conclusion
The new Xcode Debug Console allows you to navigate better debug logs and increase productivity while debugging. You can control which metadata will show, and you can use advanced filters only to display the logs you’re interested in.
If you like to improve your Xcode knowledge, even more, check out the Xcode category page. Feel free to contact me or tweet me on Twitter if you have any additional tips or feedback.
Thanks!