

Xcode Instruments is a powerful tool that ships with Xcode and lets you analyze, debug, and optimize your code, including Swift Concurrency. It comes with so-called templates that consist of multiple instruments. After running your app through Xcode Instruments, you’ll get a detailed overview of the performance of your app.
I started developing apps in 2009, when devices weren’t as fast as they are today. Xcode Instruments were basically a requirement to make your app functional at all. Unfortunately, nowadays we’ve become a bit lazy about using Xcode Instruments. It feels less needed because apps run pretty fast by default due to optimized tooling and devices. Yet, agentic development reintroduces the risk of low-performance applications, as the generated code might not perform as expected. This article will demonstrate how you can use Xcode Instruments to optimize a piece of Swift Concurrency code.

Video: Using Xcode Instruments to improve Swift Concurrency Code
This article is based on the following YouTube video, which I highly recommend watching. Xcode Instruments is complex and challenging, and best explained using a video tutorial:
FREE 5-Day Email Course: The Swift Concurrency Playbook
A FREE 5-day email course revealing the 5 biggest mistakes iOS developers make with with async/await that lead to App Store rejections And migration projects taking months instead of days (even if you've been writing Swift for years)
The importance of Xcode Instruments
I want to start by explaining the importance of Xcode Instruments. While debugging, many of our apps are not in their most advanced state. It’s very likely that you just installed the app and that it doesn’t contain much data. Real users might be using your apps for a longer time, slowly growing its data usage.
Optimizing your apps for real-world scenarios means zooming in on the details. In the above video, I demonstrate an application that’s already fast during debugging. However, the essential point is that I’m using only 100 wallpapers, which should always perform quickly! What if a user ends up with 10,000 wallpapers?
If you zoom in on a piece of code using Instruments, you change the scale and surface potential performance issues that would only become visible at a larger scale. Being lazy and assuming good performance will sooner or later bite you back.
Understanding the difference between templates and instruments
When using Xcode Instruments, it’s essential to know the difference between templates and instruments. It’s a small detail, but it helped me better understand why the Time Profiler showed up in pretty much every template.
When opening the app, you’ll get a default selection of templates to use:
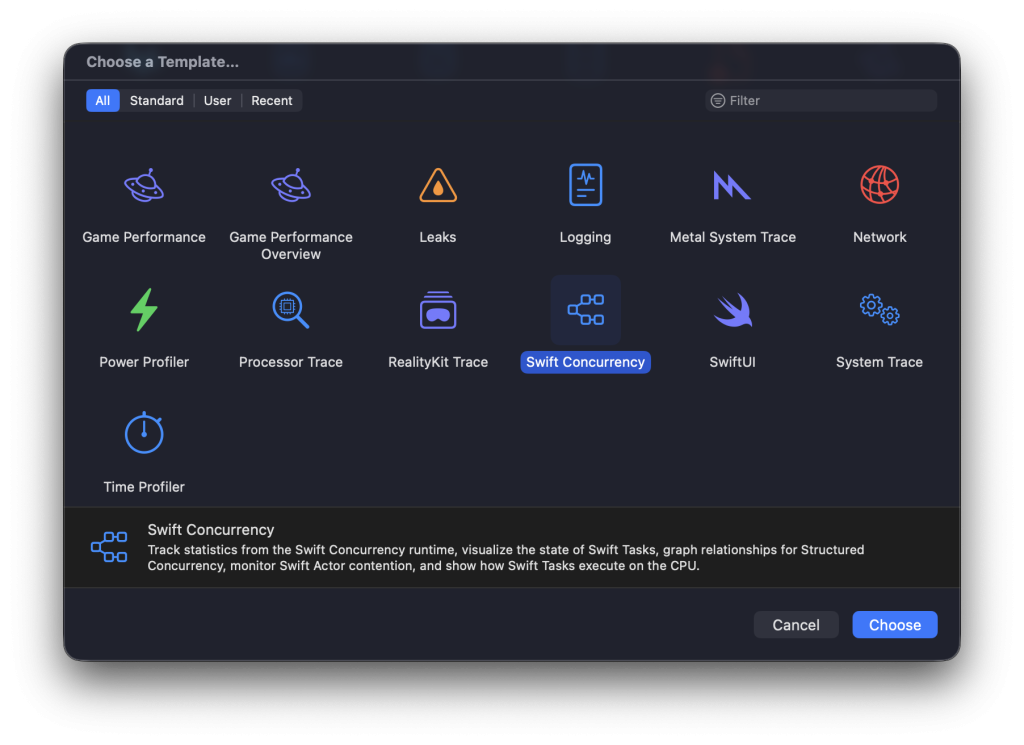
In the above screenshot, I’ve selected the Swift Concurrency template, which is described as:
Track statistics from the Swift Concurrency runtime, visualize the state of Swift Tasks, graph relationships for Structured Concurrency, monitor Swift Actor contention, and show how Swift Tasks execute on the CPU.
It explains what you can do with the template and already hints at several individual instruments. Because if we open the template, we’ll notice a selection of instruments:
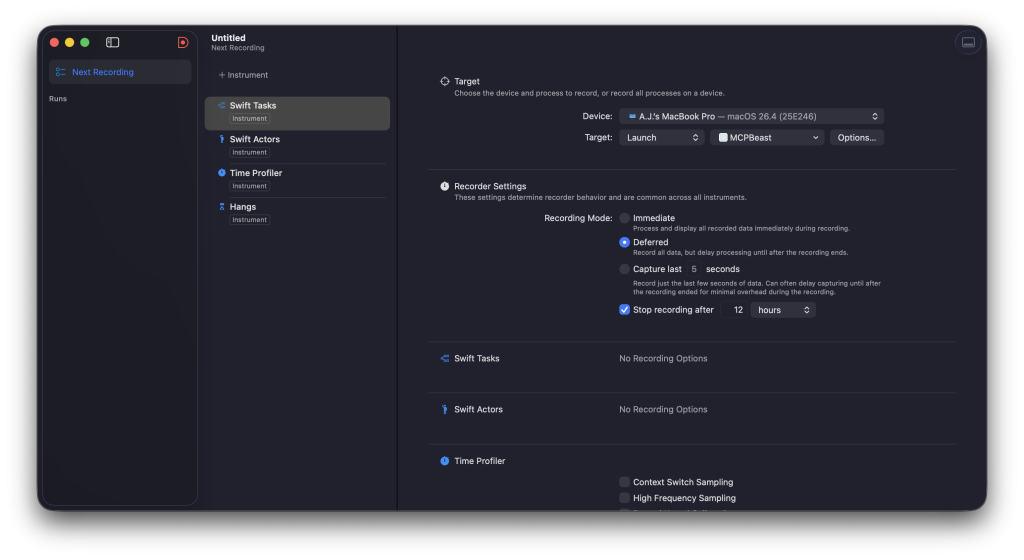
In this template, we’ll get four different instruments:
- Swift Tasks
Tracks task lifetime and state changes - Swift Actors
Shows actor execution and queue size - Time Profiler
Shows where time is spent in your code - Hangs
Detects when the main thread is blocked
Each instrument has its own purpose, and you might not always use each. The above video demonstrates each of these along the way.
Code & Read along Tutorial
The above video is great, but I can totally understand that you want to read along at your own pace, or access the code example and try it out yourself.
I’m happy to invite you to my detailed Swift Concurrency Course, which comes with a dedicated module on performance. It includes all the materials from the video and text-based lessons that go over each performance improvement step in detail.
Check out swiftconcurrencycourse.com for more details.
Thanks!